The Canadian Institutes of Health Research (CIHR) is the largest funder of health research in Canada, supporting over 15,000 world-class researchers from all pillars of health research and from all regions of Canada.
The following graphs provide a breakdown of CIHR's investments. For this year and henceforth, the information presented does not include data that precedes CIHR's formation in the 2000-2001 fiscal year.
2024-2025
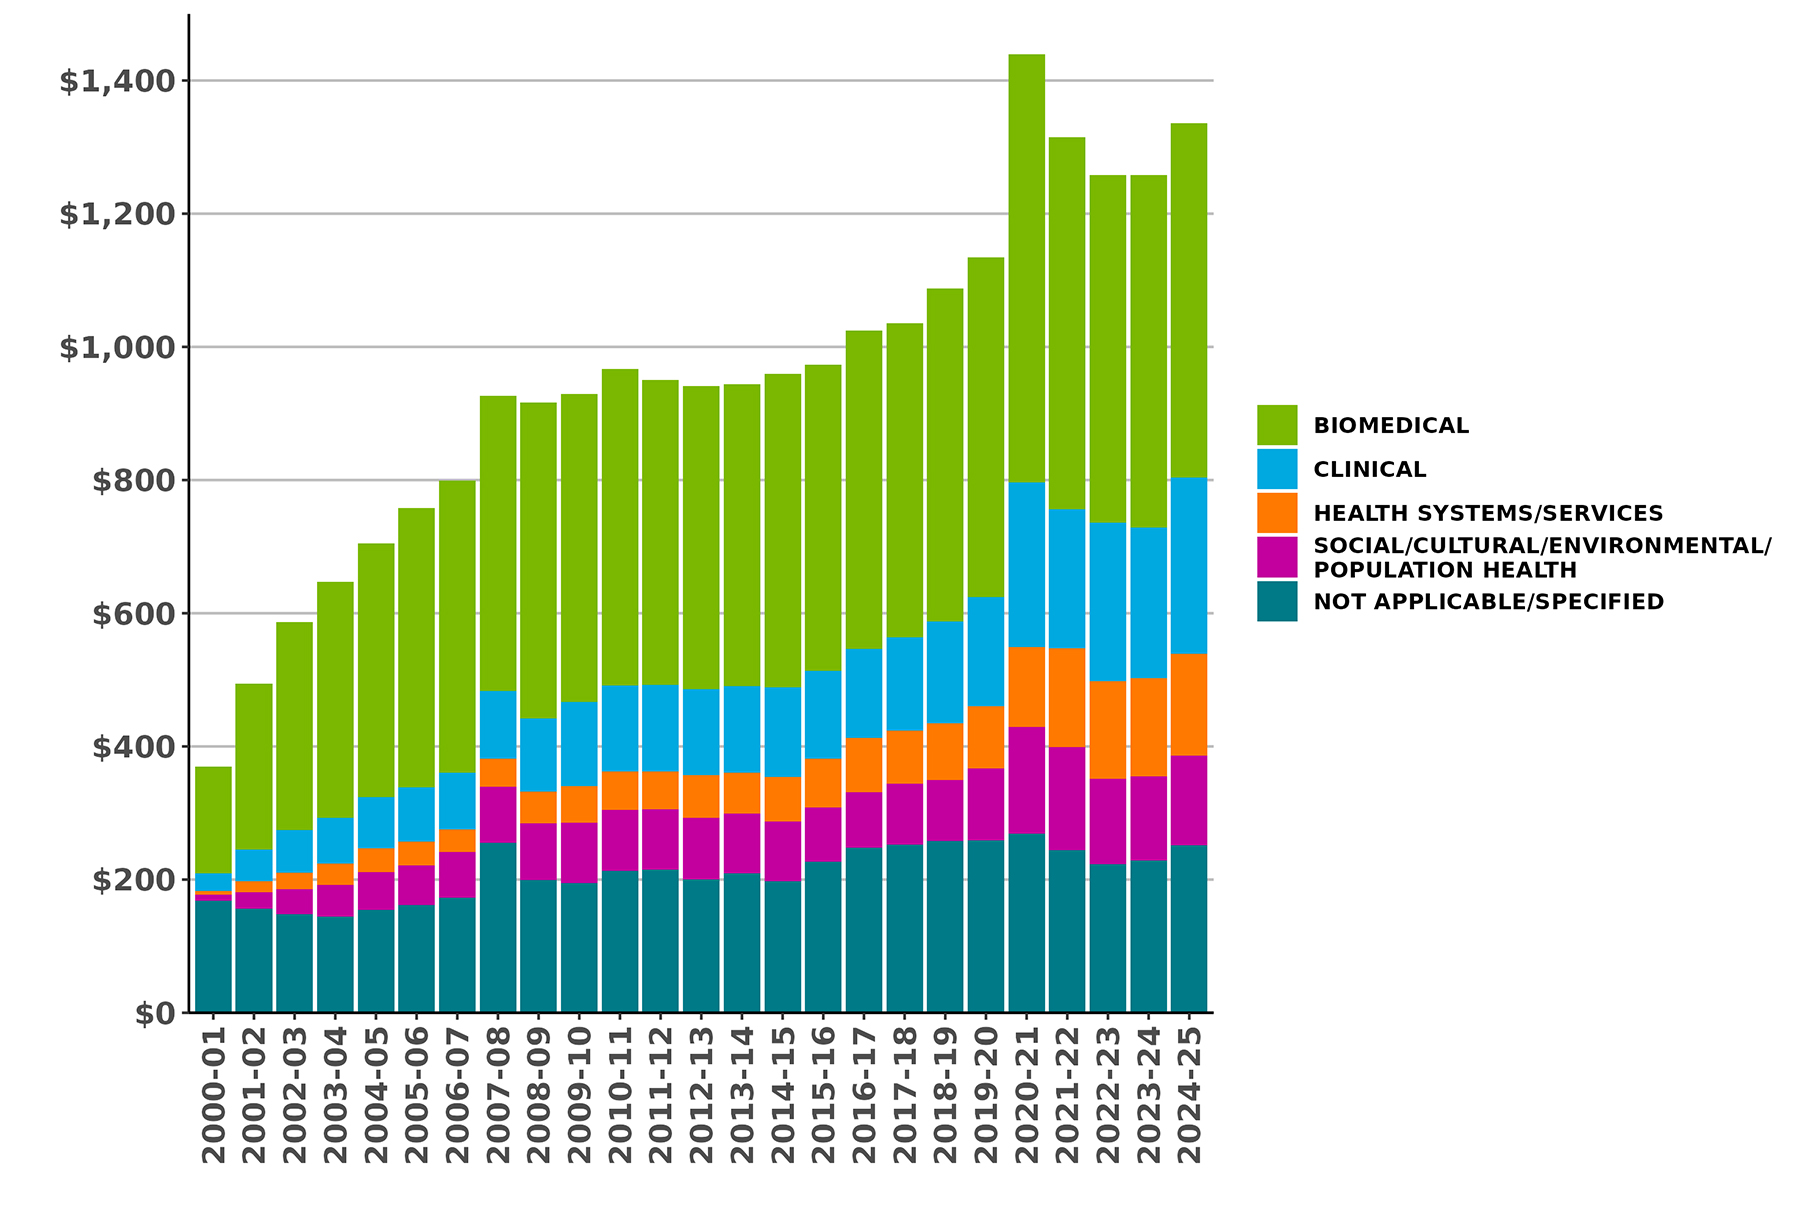
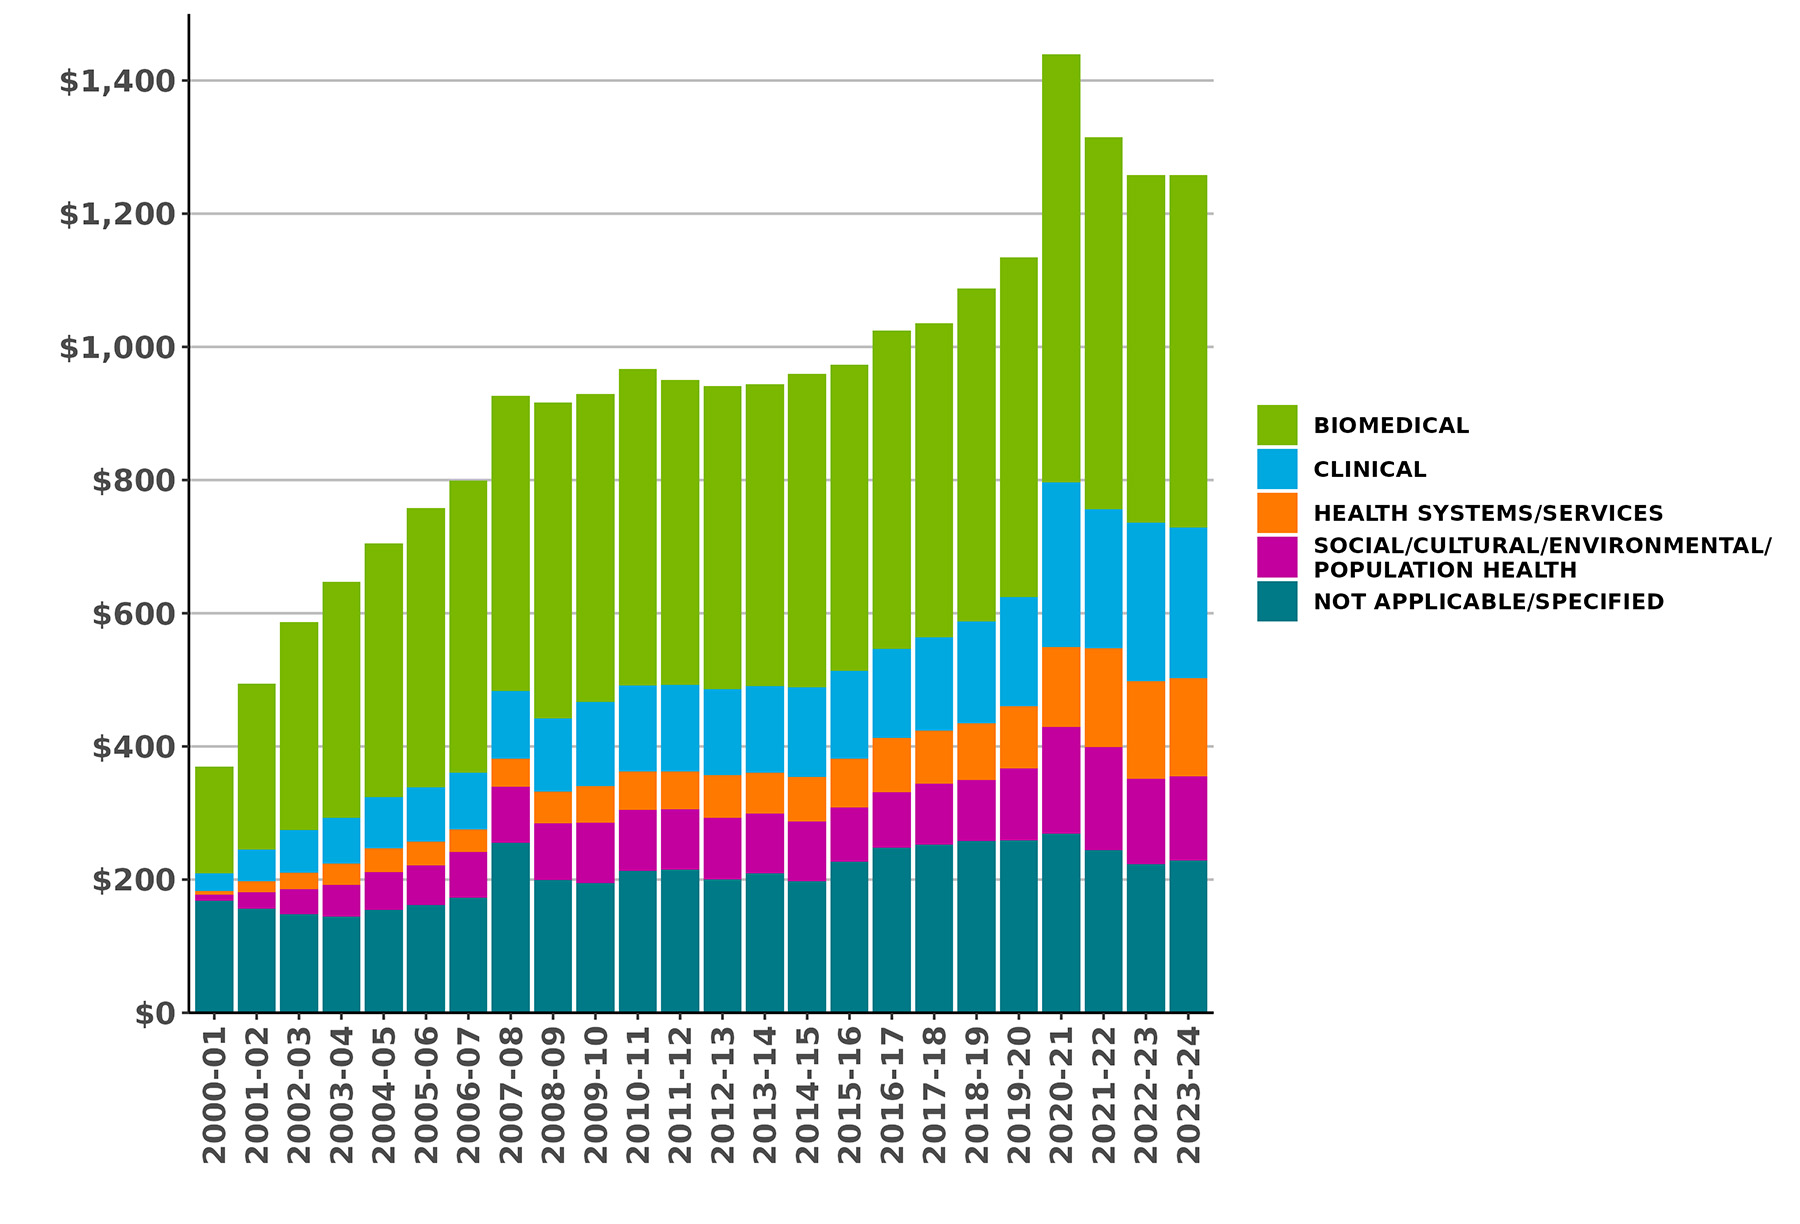
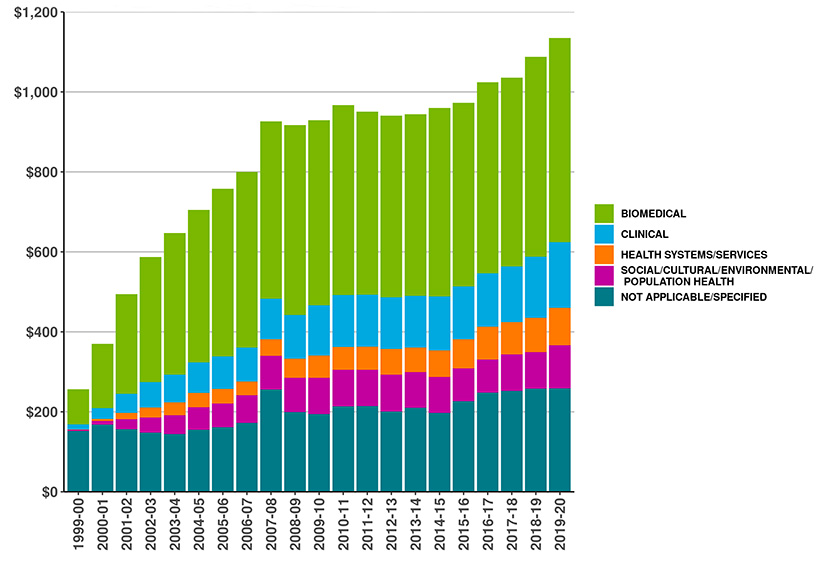
Figure 1: CIHR Fiscal Year Investments by Primary Theme since 2000-01 (in millions of dollars)
Due to rounding, figures may not reconcile with other published information
Excludes operating expenditures and partner contributions
Primary theme designation is determined by the grantee at the time of application
Figure 1 long description
Primary theme
2000-01
2001-02
2002-03
2003-04
2004-05
2005-06
2006-07
2007-08
2008-09
2009-10
2010-11
2011-12
2012-13
2013-14
2014-15
2015-16
2016-17
2017-18
2018-19
2019-20
2020-21
2021-22
2022-23
2023-24
2024-25
Biomedical
$160
$250
$312
$354
$381
$419
$439
$444
$474
$463
$475
$458
$455
$454
$471
$459
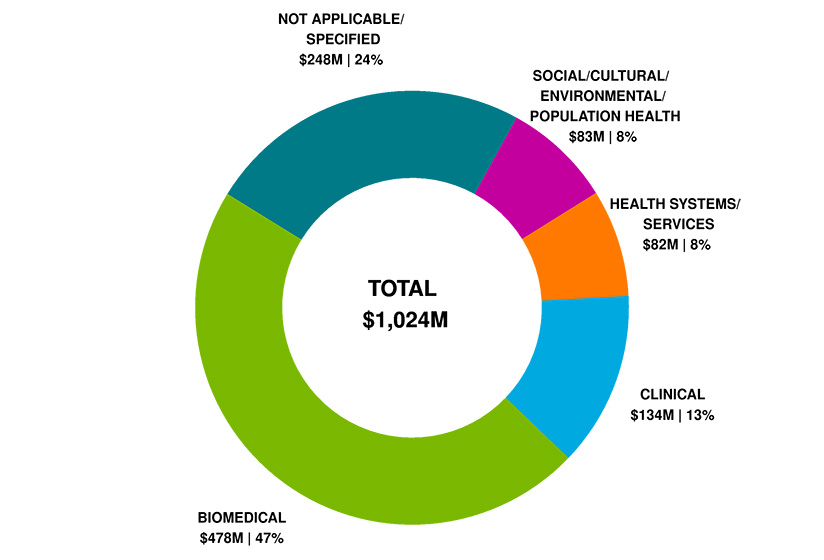
$478
$472
$500
$510
$643
$559
$522
$530
$532
Clinical
$27
$47
$64
$69
$77
$82
$85
$101
$110
$126
$129
$130
$129
$130
$134
$132
$134
$140
$153
$164
$247
$209
$238
$226
$265
Health systems/services
$5
$16
$25
$32
$36
$36
$34
$42
$48
$56
$58
$57
$64
$61
$67
$73
$82
$81
$86
$94
$120
$148
$147
$148
$152
Social/Cultural/Environmental/Population Health
$9
$25
$38
$48
$57
$60
$69
$84
$85
$91
$91
$91
$92
$90
$90
$82
$83
$91
$92
$108
$160
$155
$128
$126
$135
Not applicable/Specified
$168
$157
$148
$144
$155
$161
$172
$255
$199
$195
$213
$215
$201
$210
$197
$227
$248
$252
$258
$259
$269
$244
$223
$228
$251
Total
$370
$495
$587
$647
$705
$758
$800
$927
$917
$929
$967
$951
$941
$944
$960
$973
$1,024
$1,035
$1,088
$1,135
$1,440
$1,315
$1,258
$1,258
$1,336
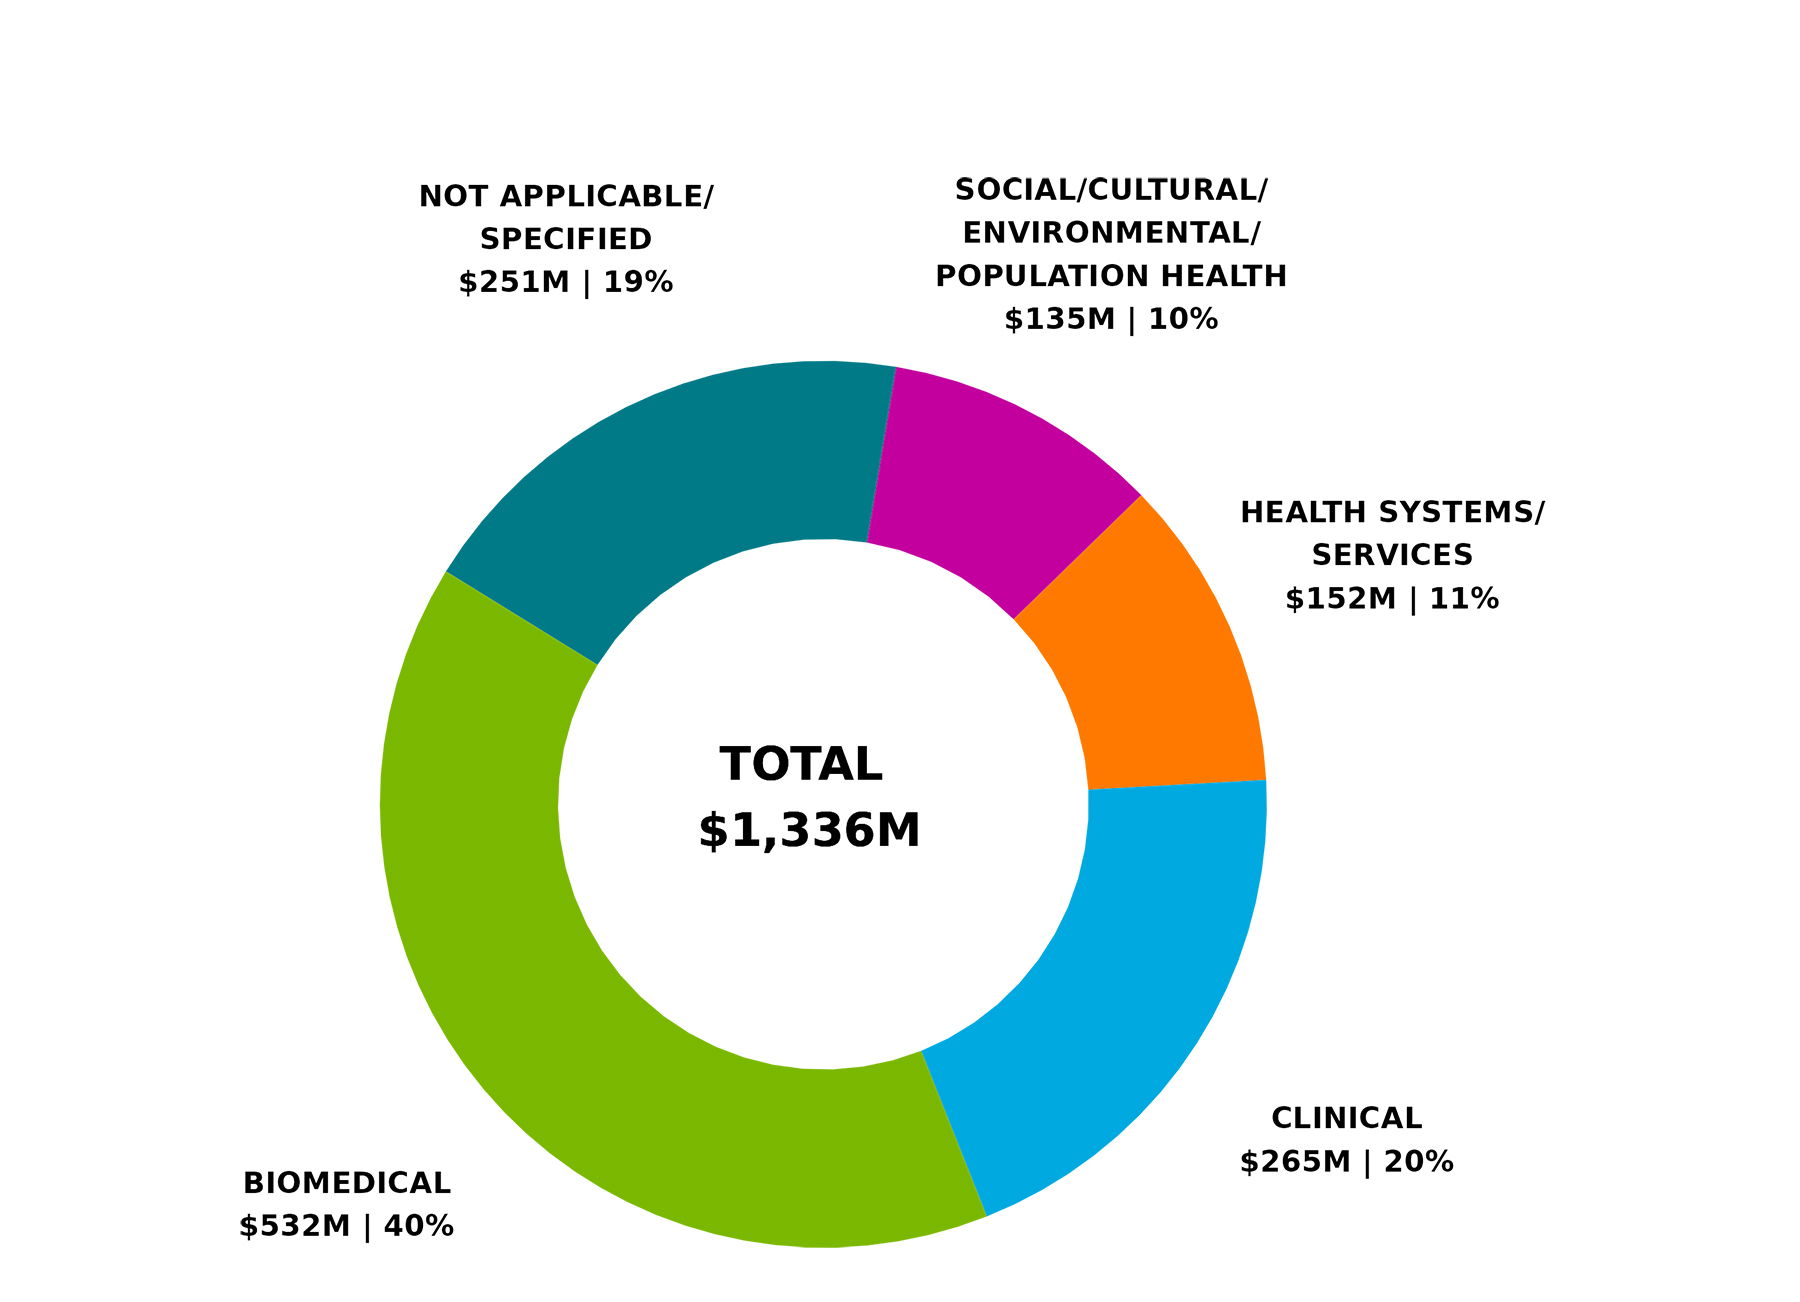
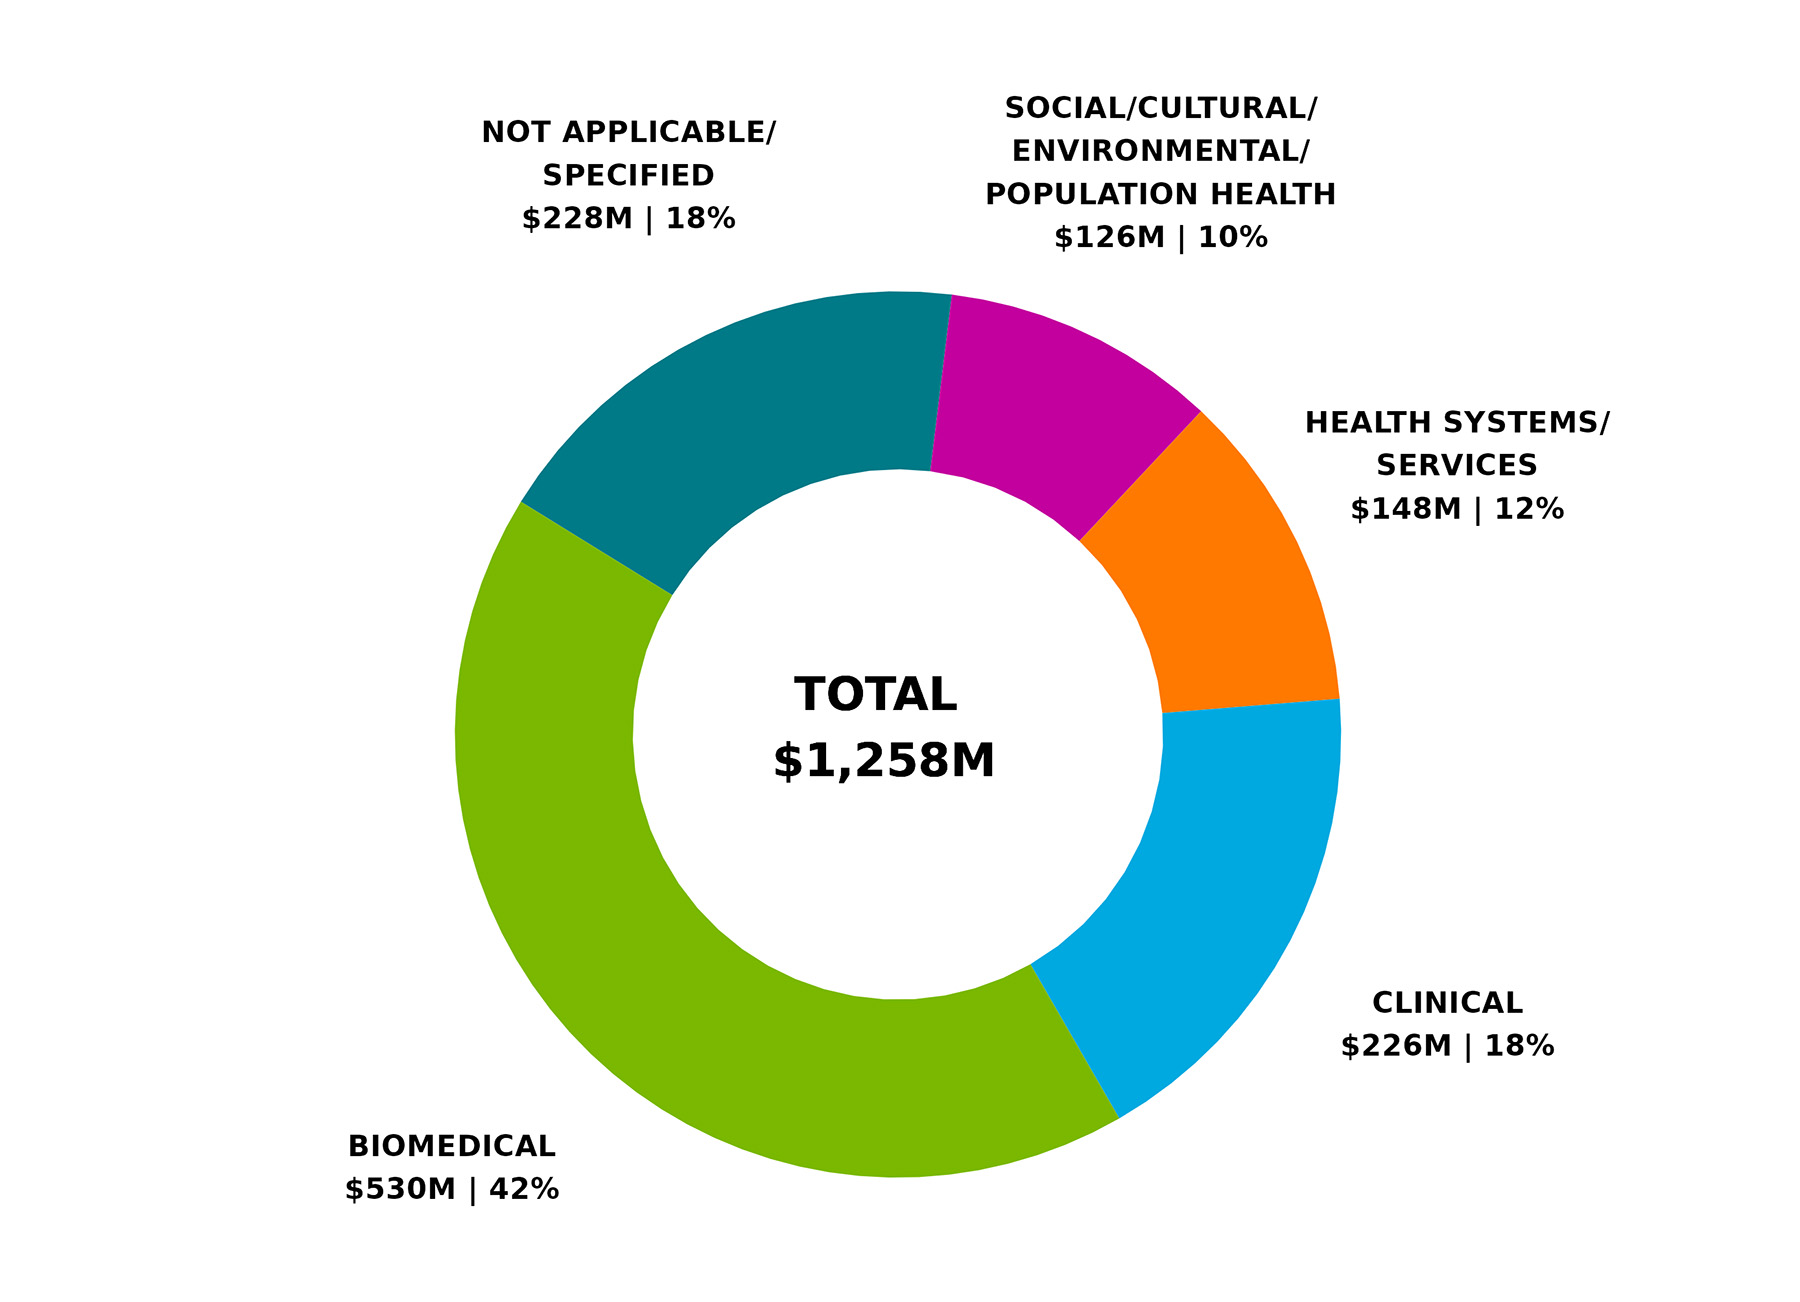
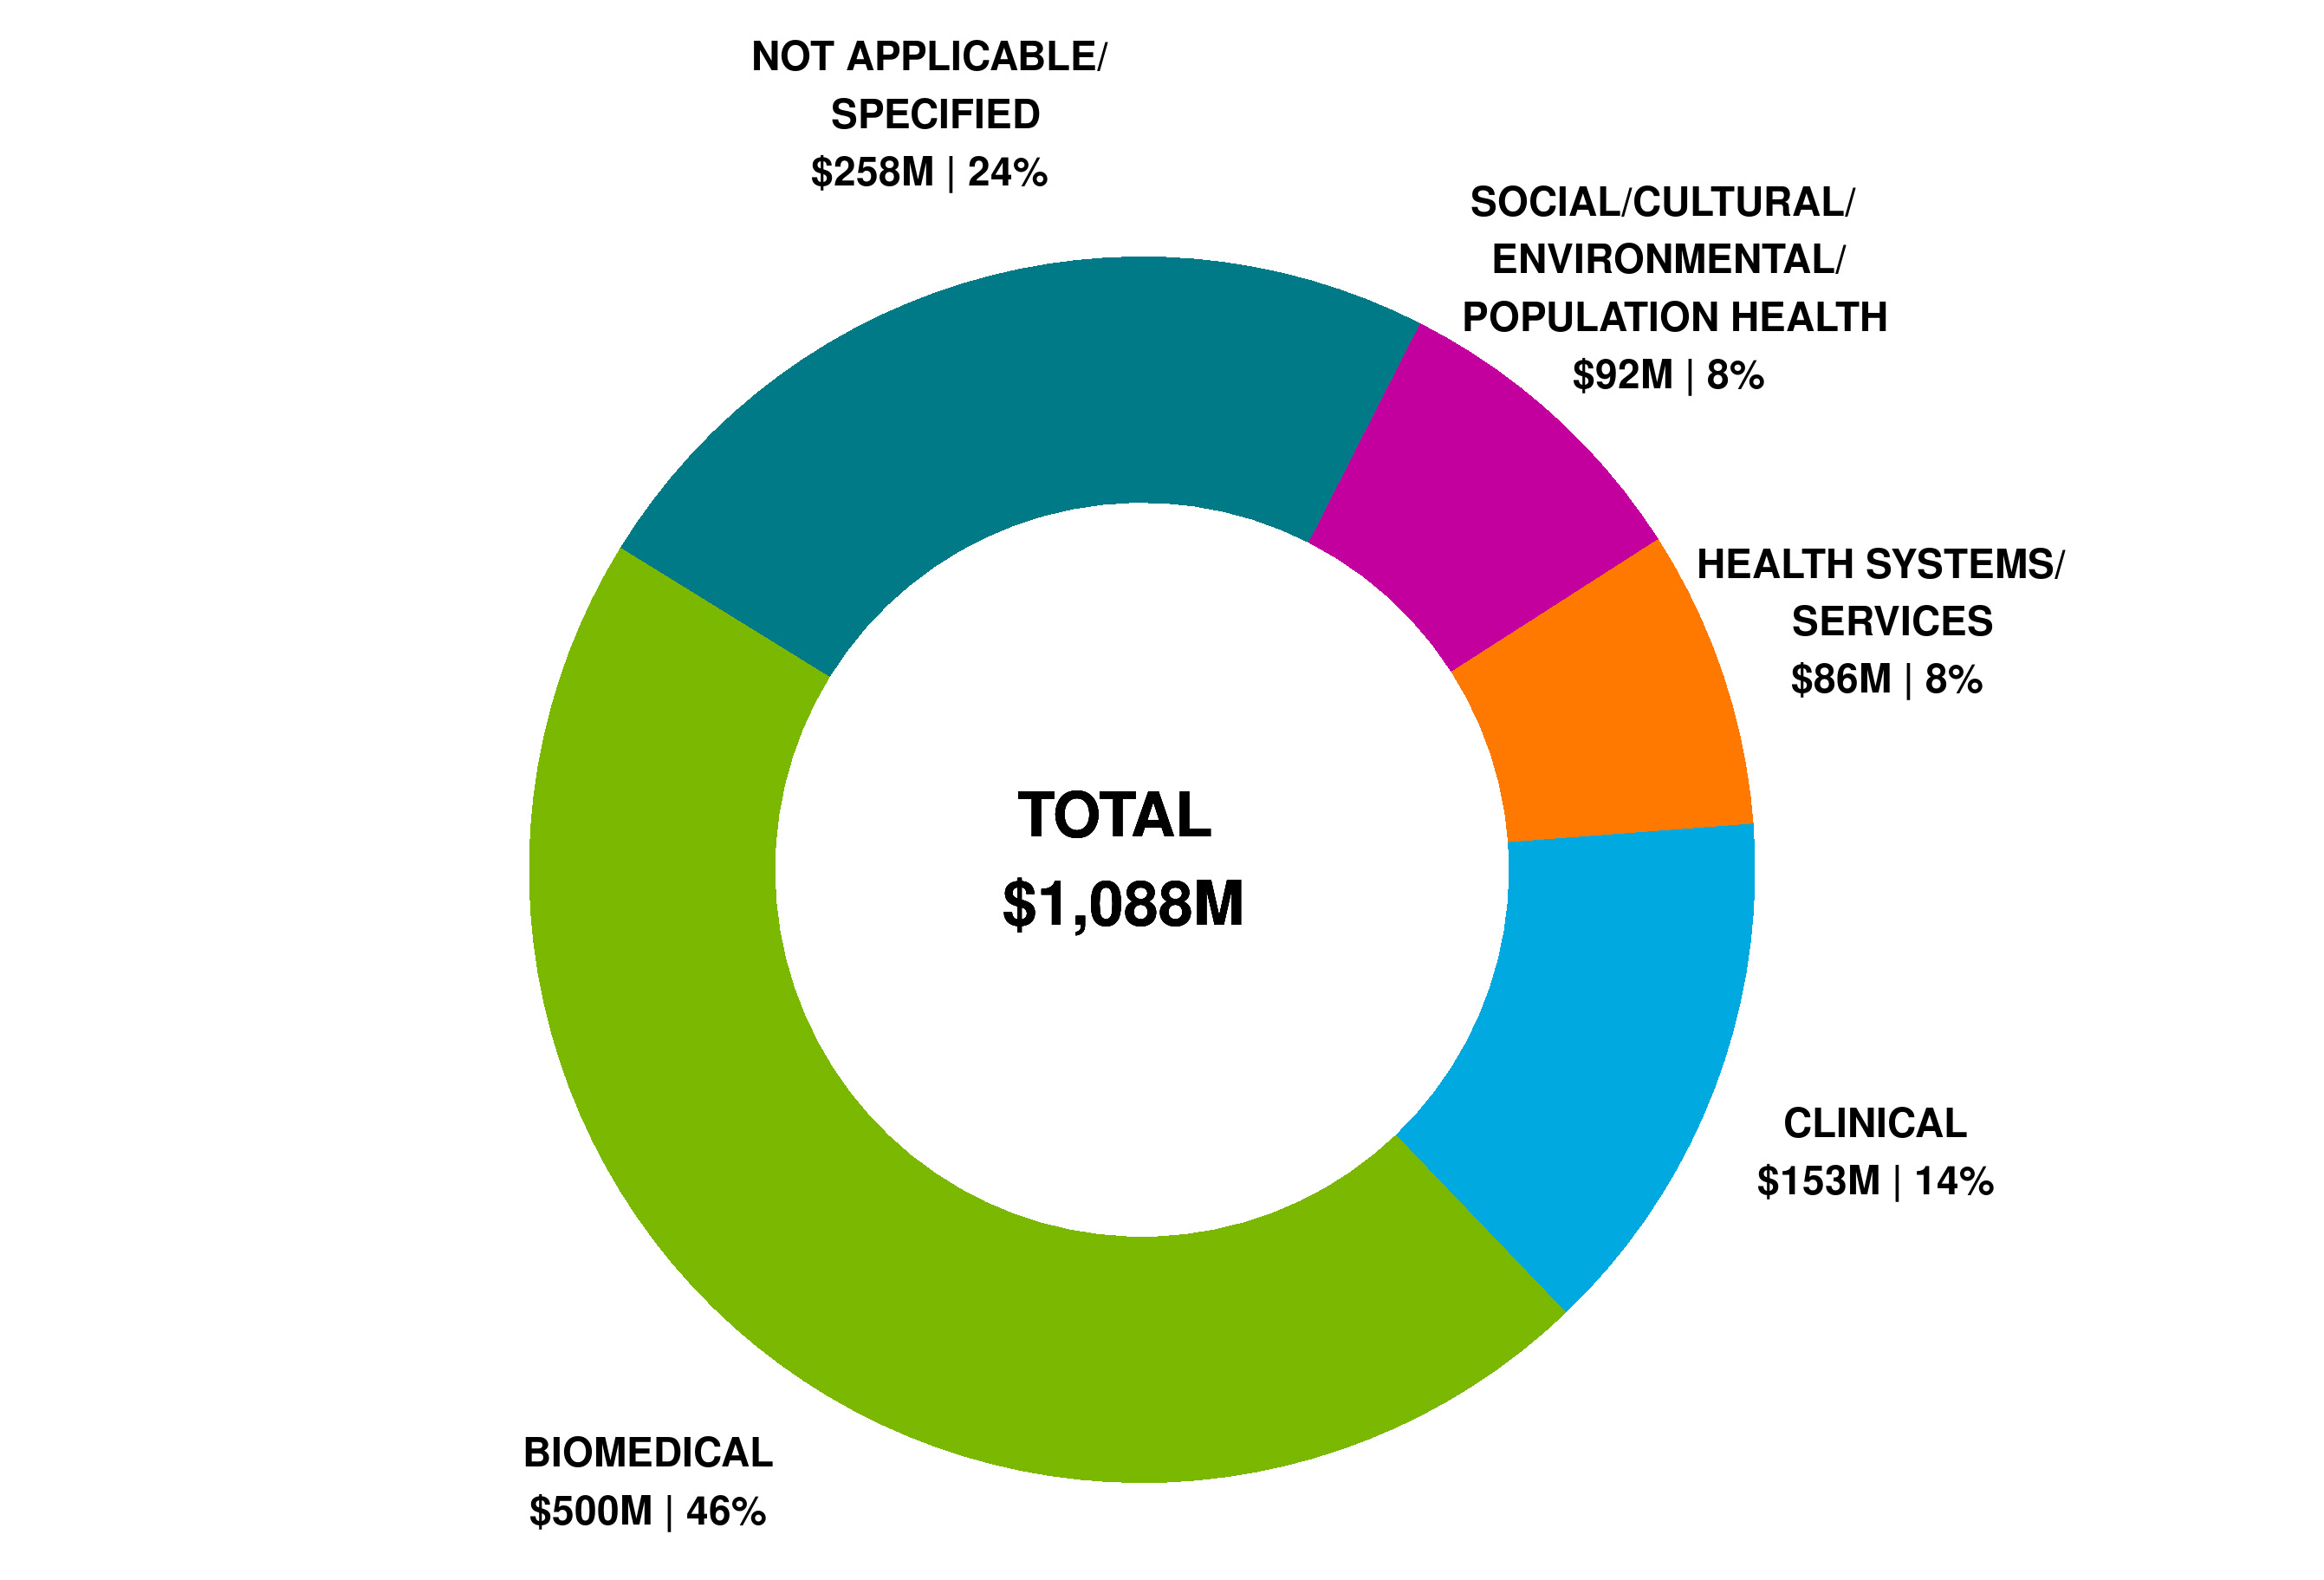
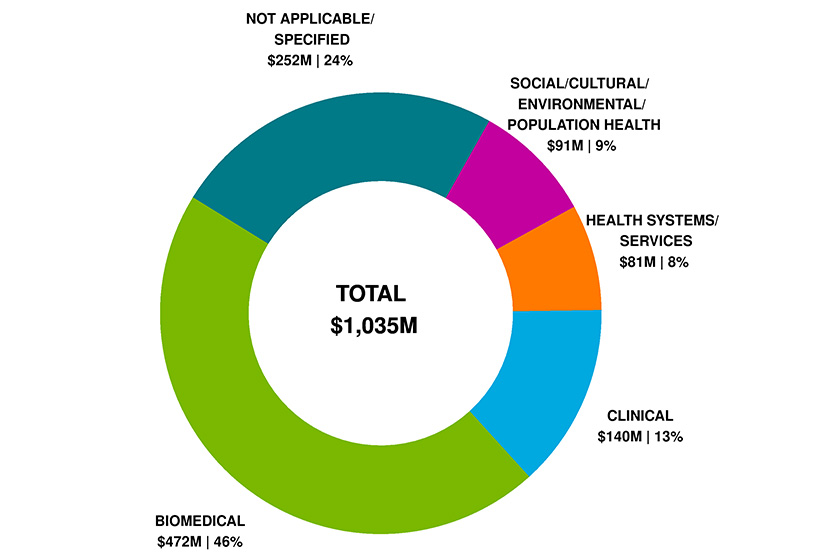
Figure 2: CIHR Investments by Primary Theme 2024-25 (in millions of dollars)
Due to rounding, figures may not reconcile with other published information
Excludes operating expenditures and partner contributions
Primary theme designation is determined by the grantee at the time of application
Figure 2 long description
Primary Theme
2024-25
Percentage Breakdown
Biomedical
$532
40%
Clinical
$265
20%
Health systems/services
$152
11%
Social/Cultural/Environmental/Population Health
$135
10%
Not applicable/Specified
$251
19%
Total
$1,335
100%
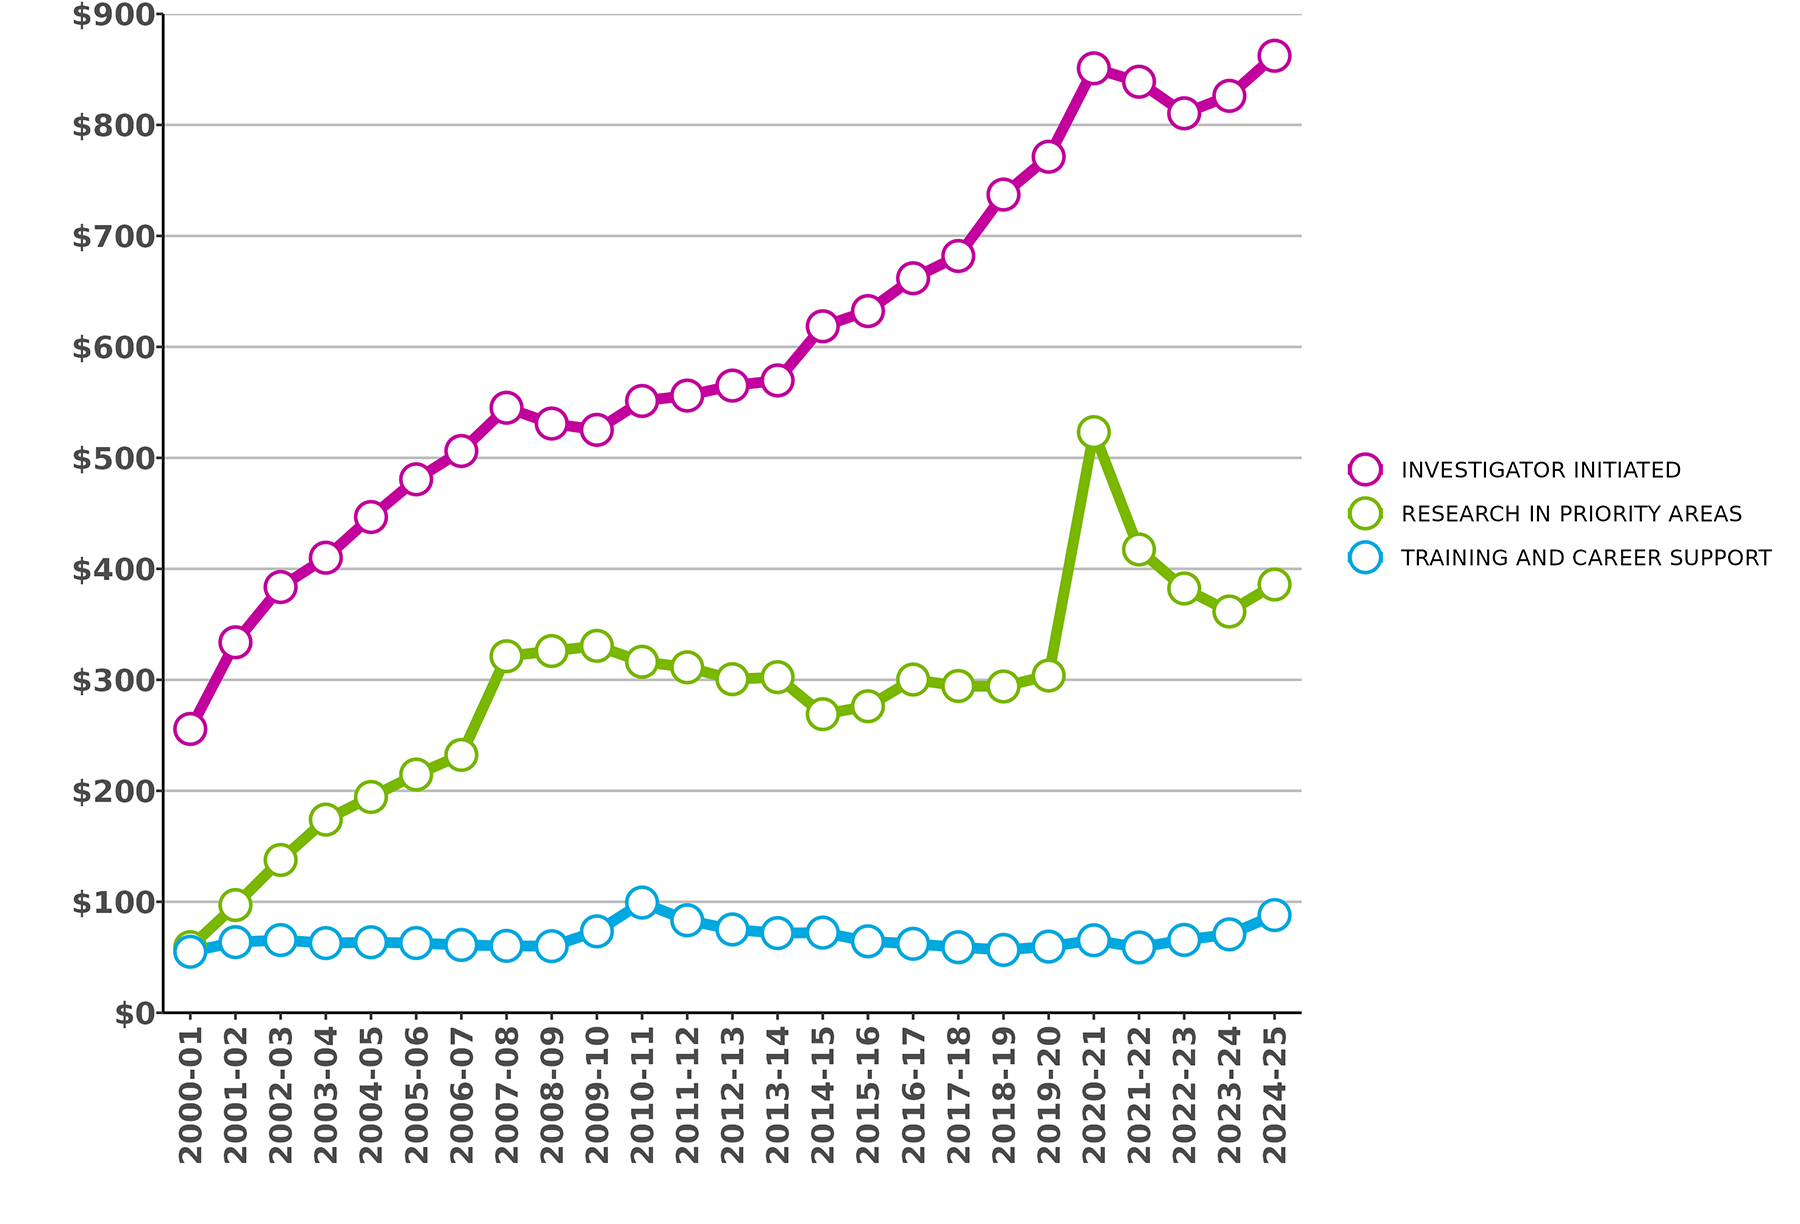
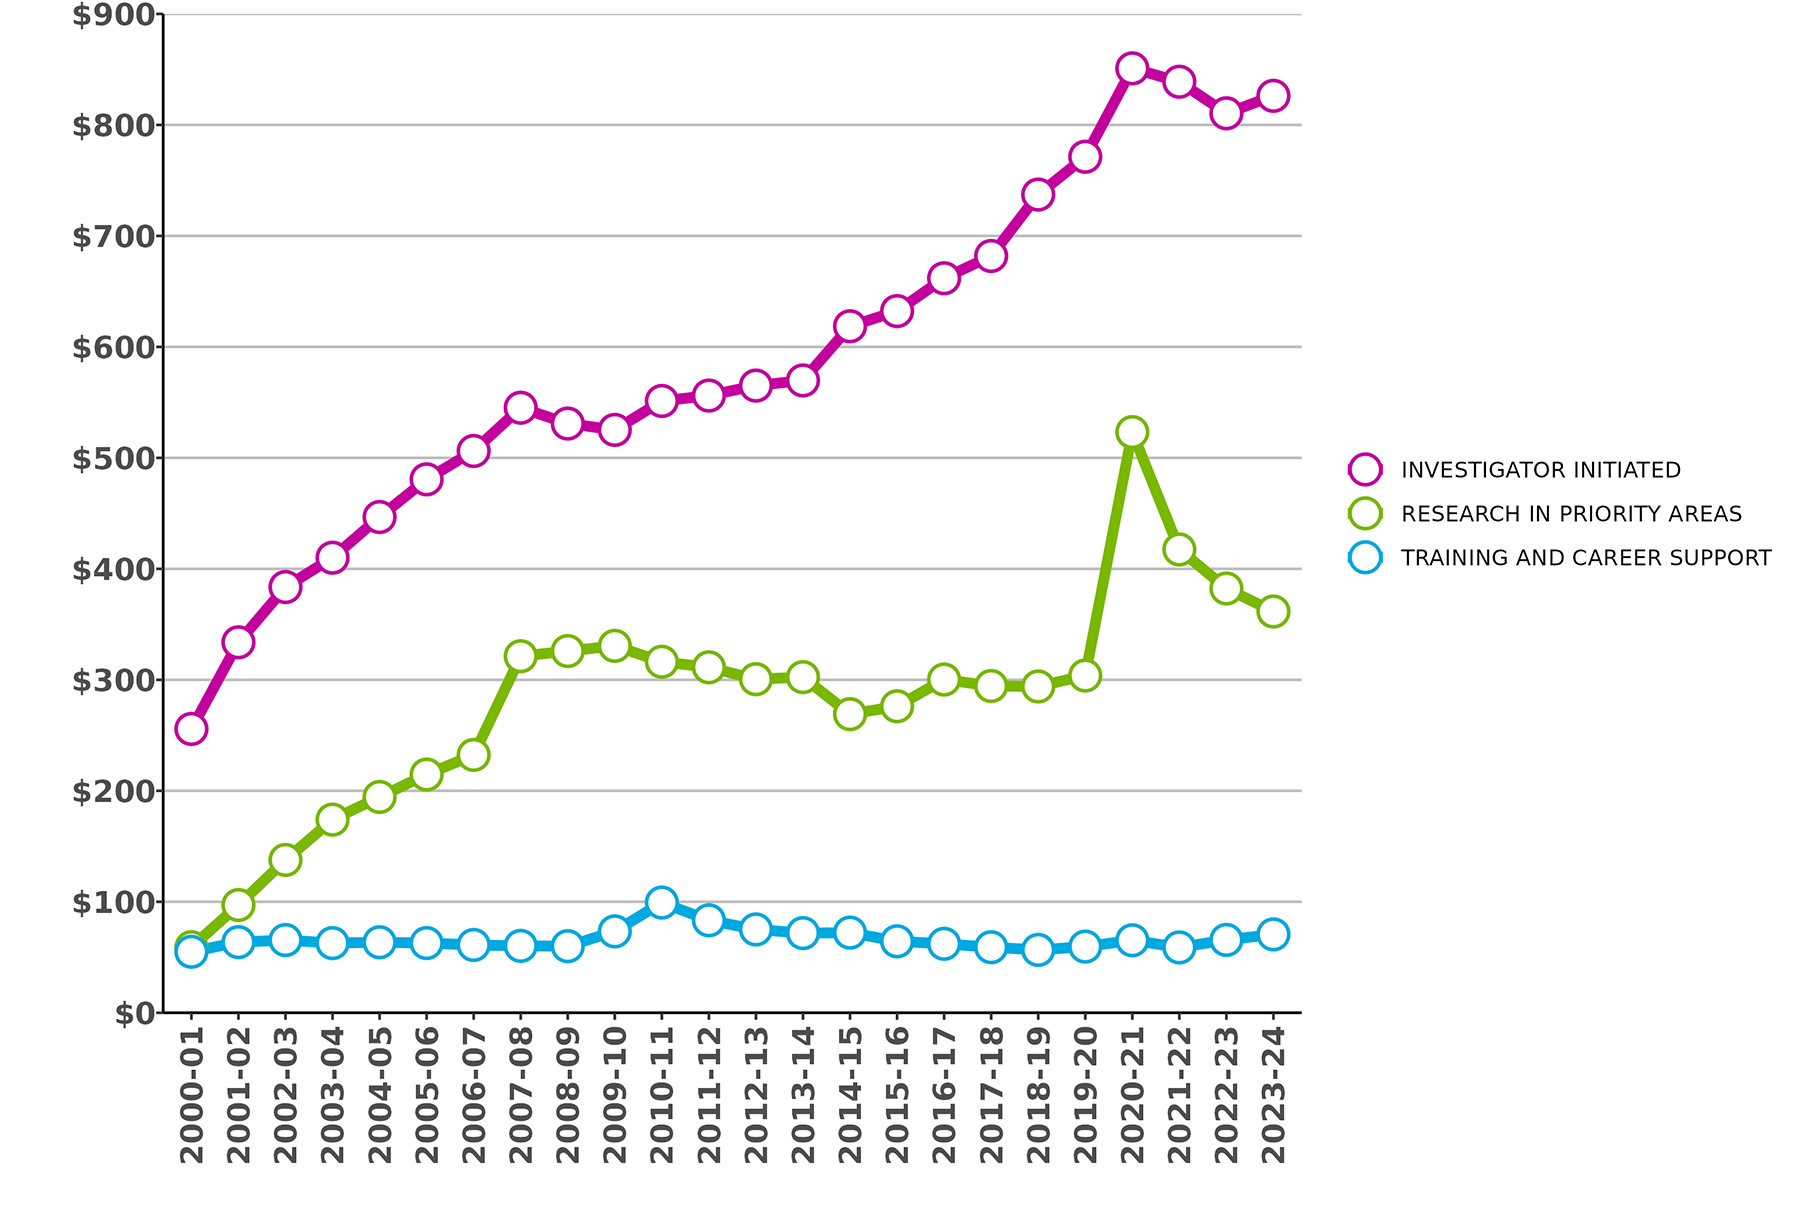
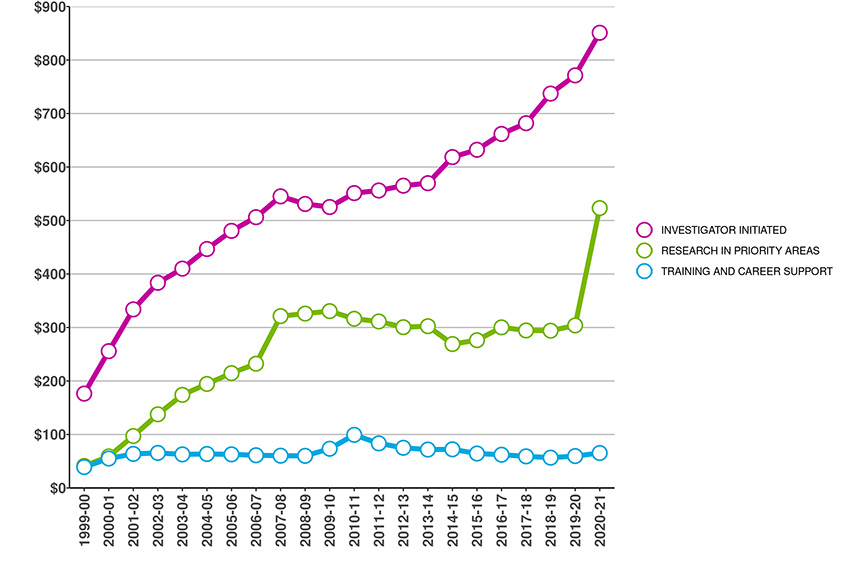
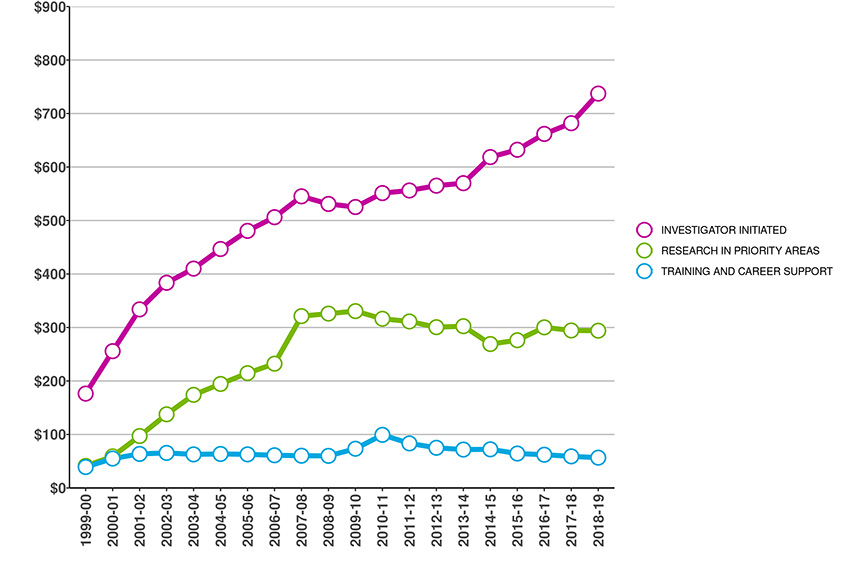
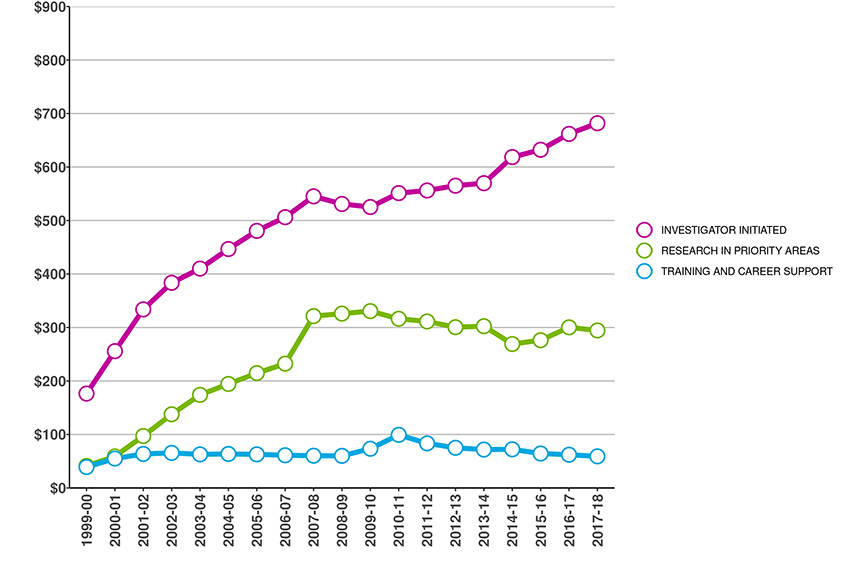
Figure 3: CIHR Fiscal Year Investments by Funding Type since 2000-01 (in millions of dollars)
Due to rounding, figures may not reconcile with other published information
Excludes operating expenditures and partner contributions
Figure 3 long description
Funding type
2000-01
2001-02
2002-03
2003-04
2004-05
2005-06
2006-07
2007-08
2008-09
2009-10
2010-11
2011-12
2012-13
2013-14
2014-15
2015-16
2016-17
2017-18
2018-19
2019-20
2020-21
2021-22
2022-23
2023-24
2024-25
Investigator Initiated
$256
$334
$384
$410
$447
$481
$506
$545
$531
$525
$551
$556
$565
$570
$619
$632
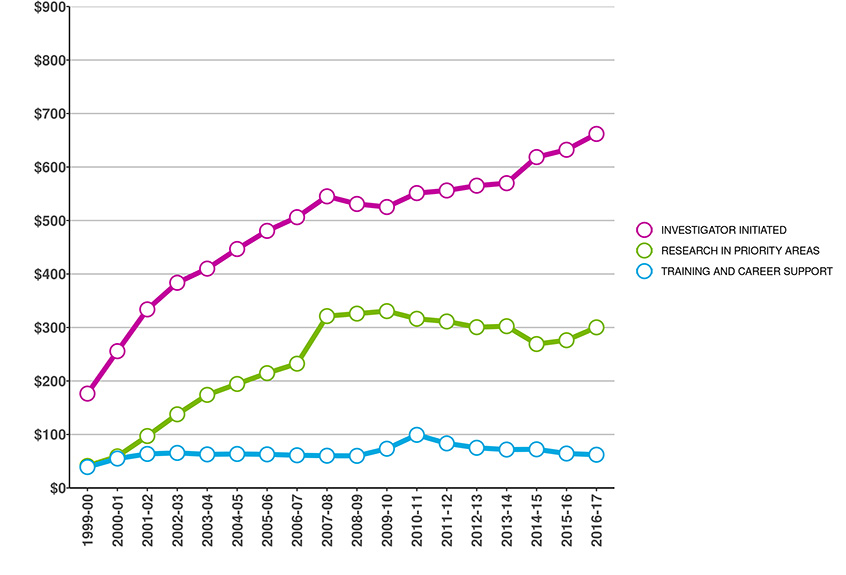
$662
$682
$737
$771
$851
$839
$810
$826
$862
Research in Priority Areas
$59
$97
$138
$174
$194
$215
$232
$321
$326
$331
$316
$311
$301
$302
$269
$276
$300
$294
$294
$304
$523
$417
$382
$362
$386
Training and Career Support
$55
$64
$66
$63
$64
$63
$61
$60
$60
$73
$99
$83
$75
$72
$72
$64
$62
$59
$57
$60
$65
$59
$66
$71
$88
Total
$370
$495
$587
$647
$705
$758
$800
$927
$917
$929
$967
$951
$941
$944
$960
$973
$1,024
$1,035
$1,088
$1,135
$1,440
$1,315
$1,258
$1,258
$1,336
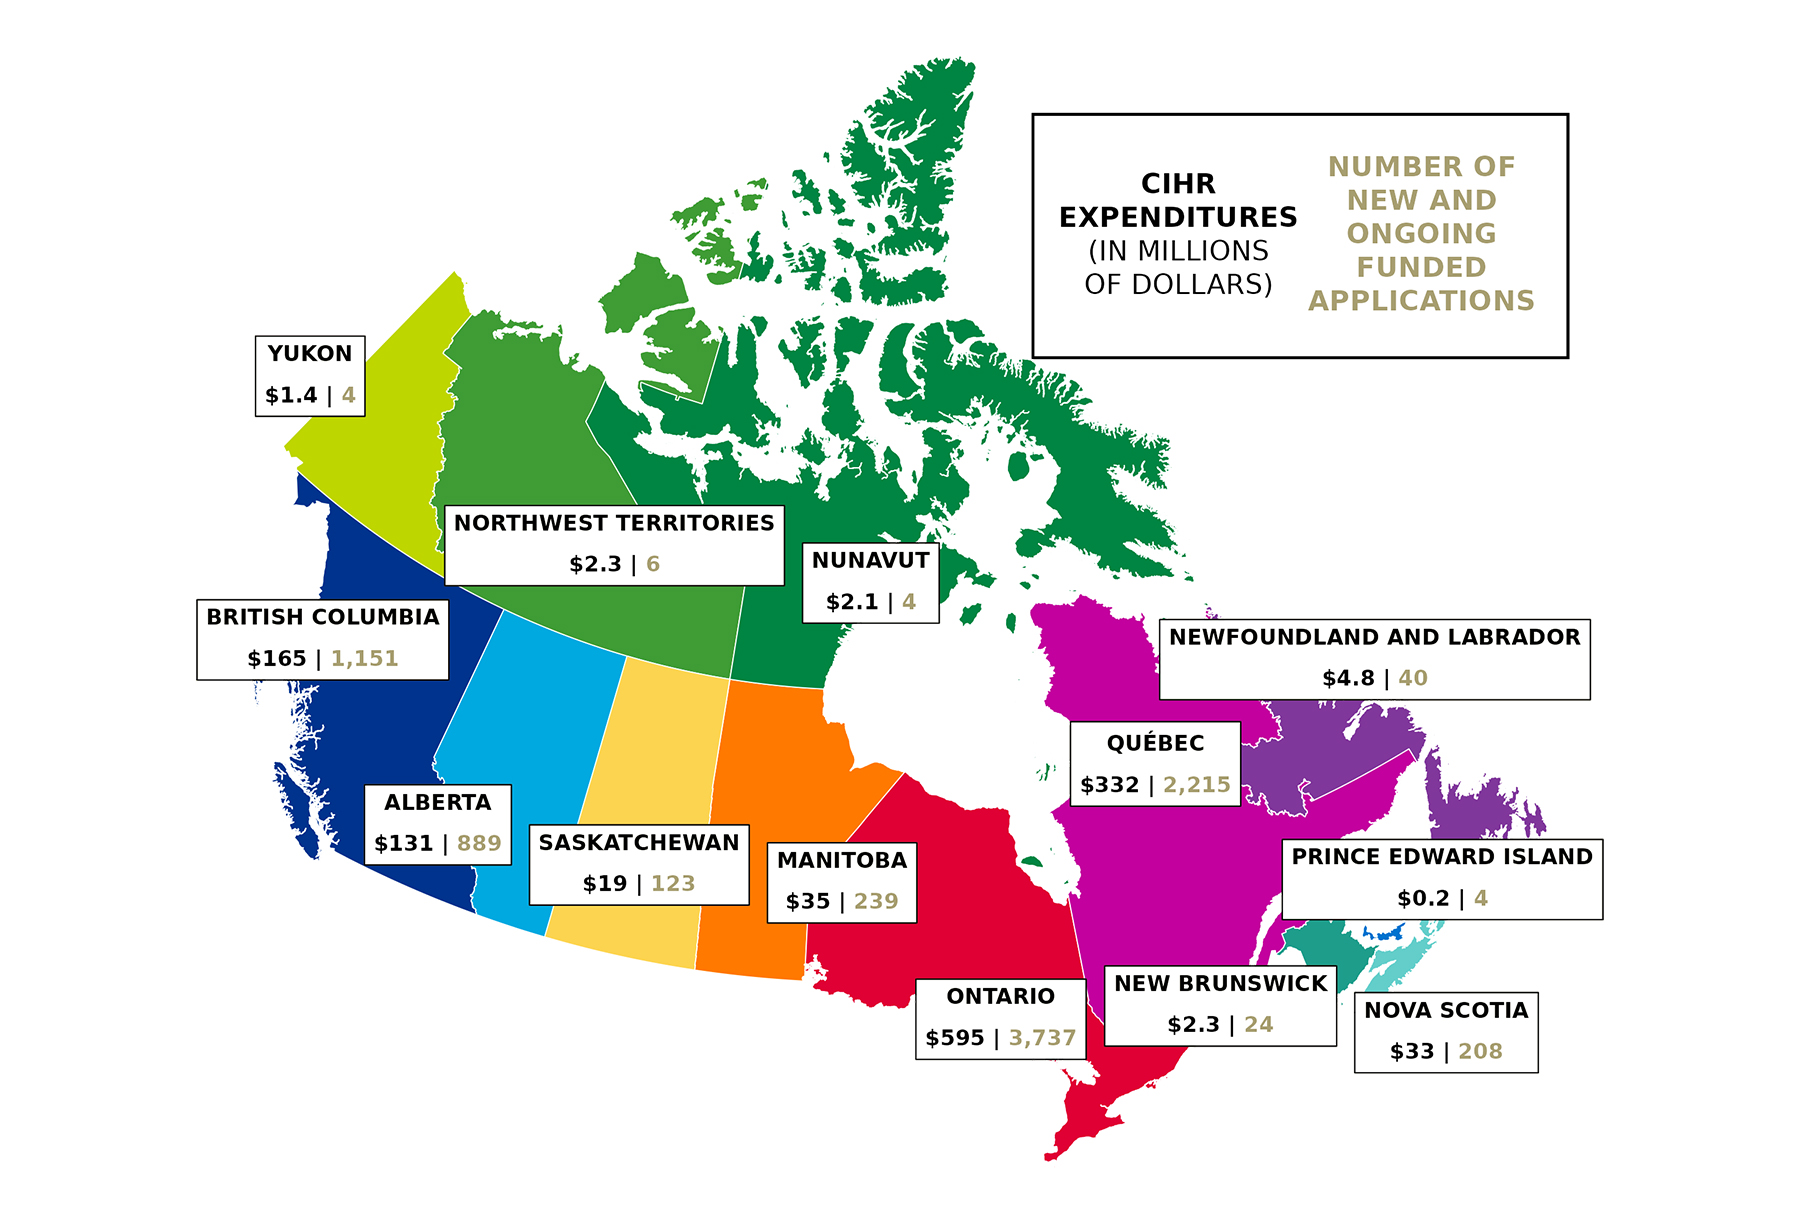
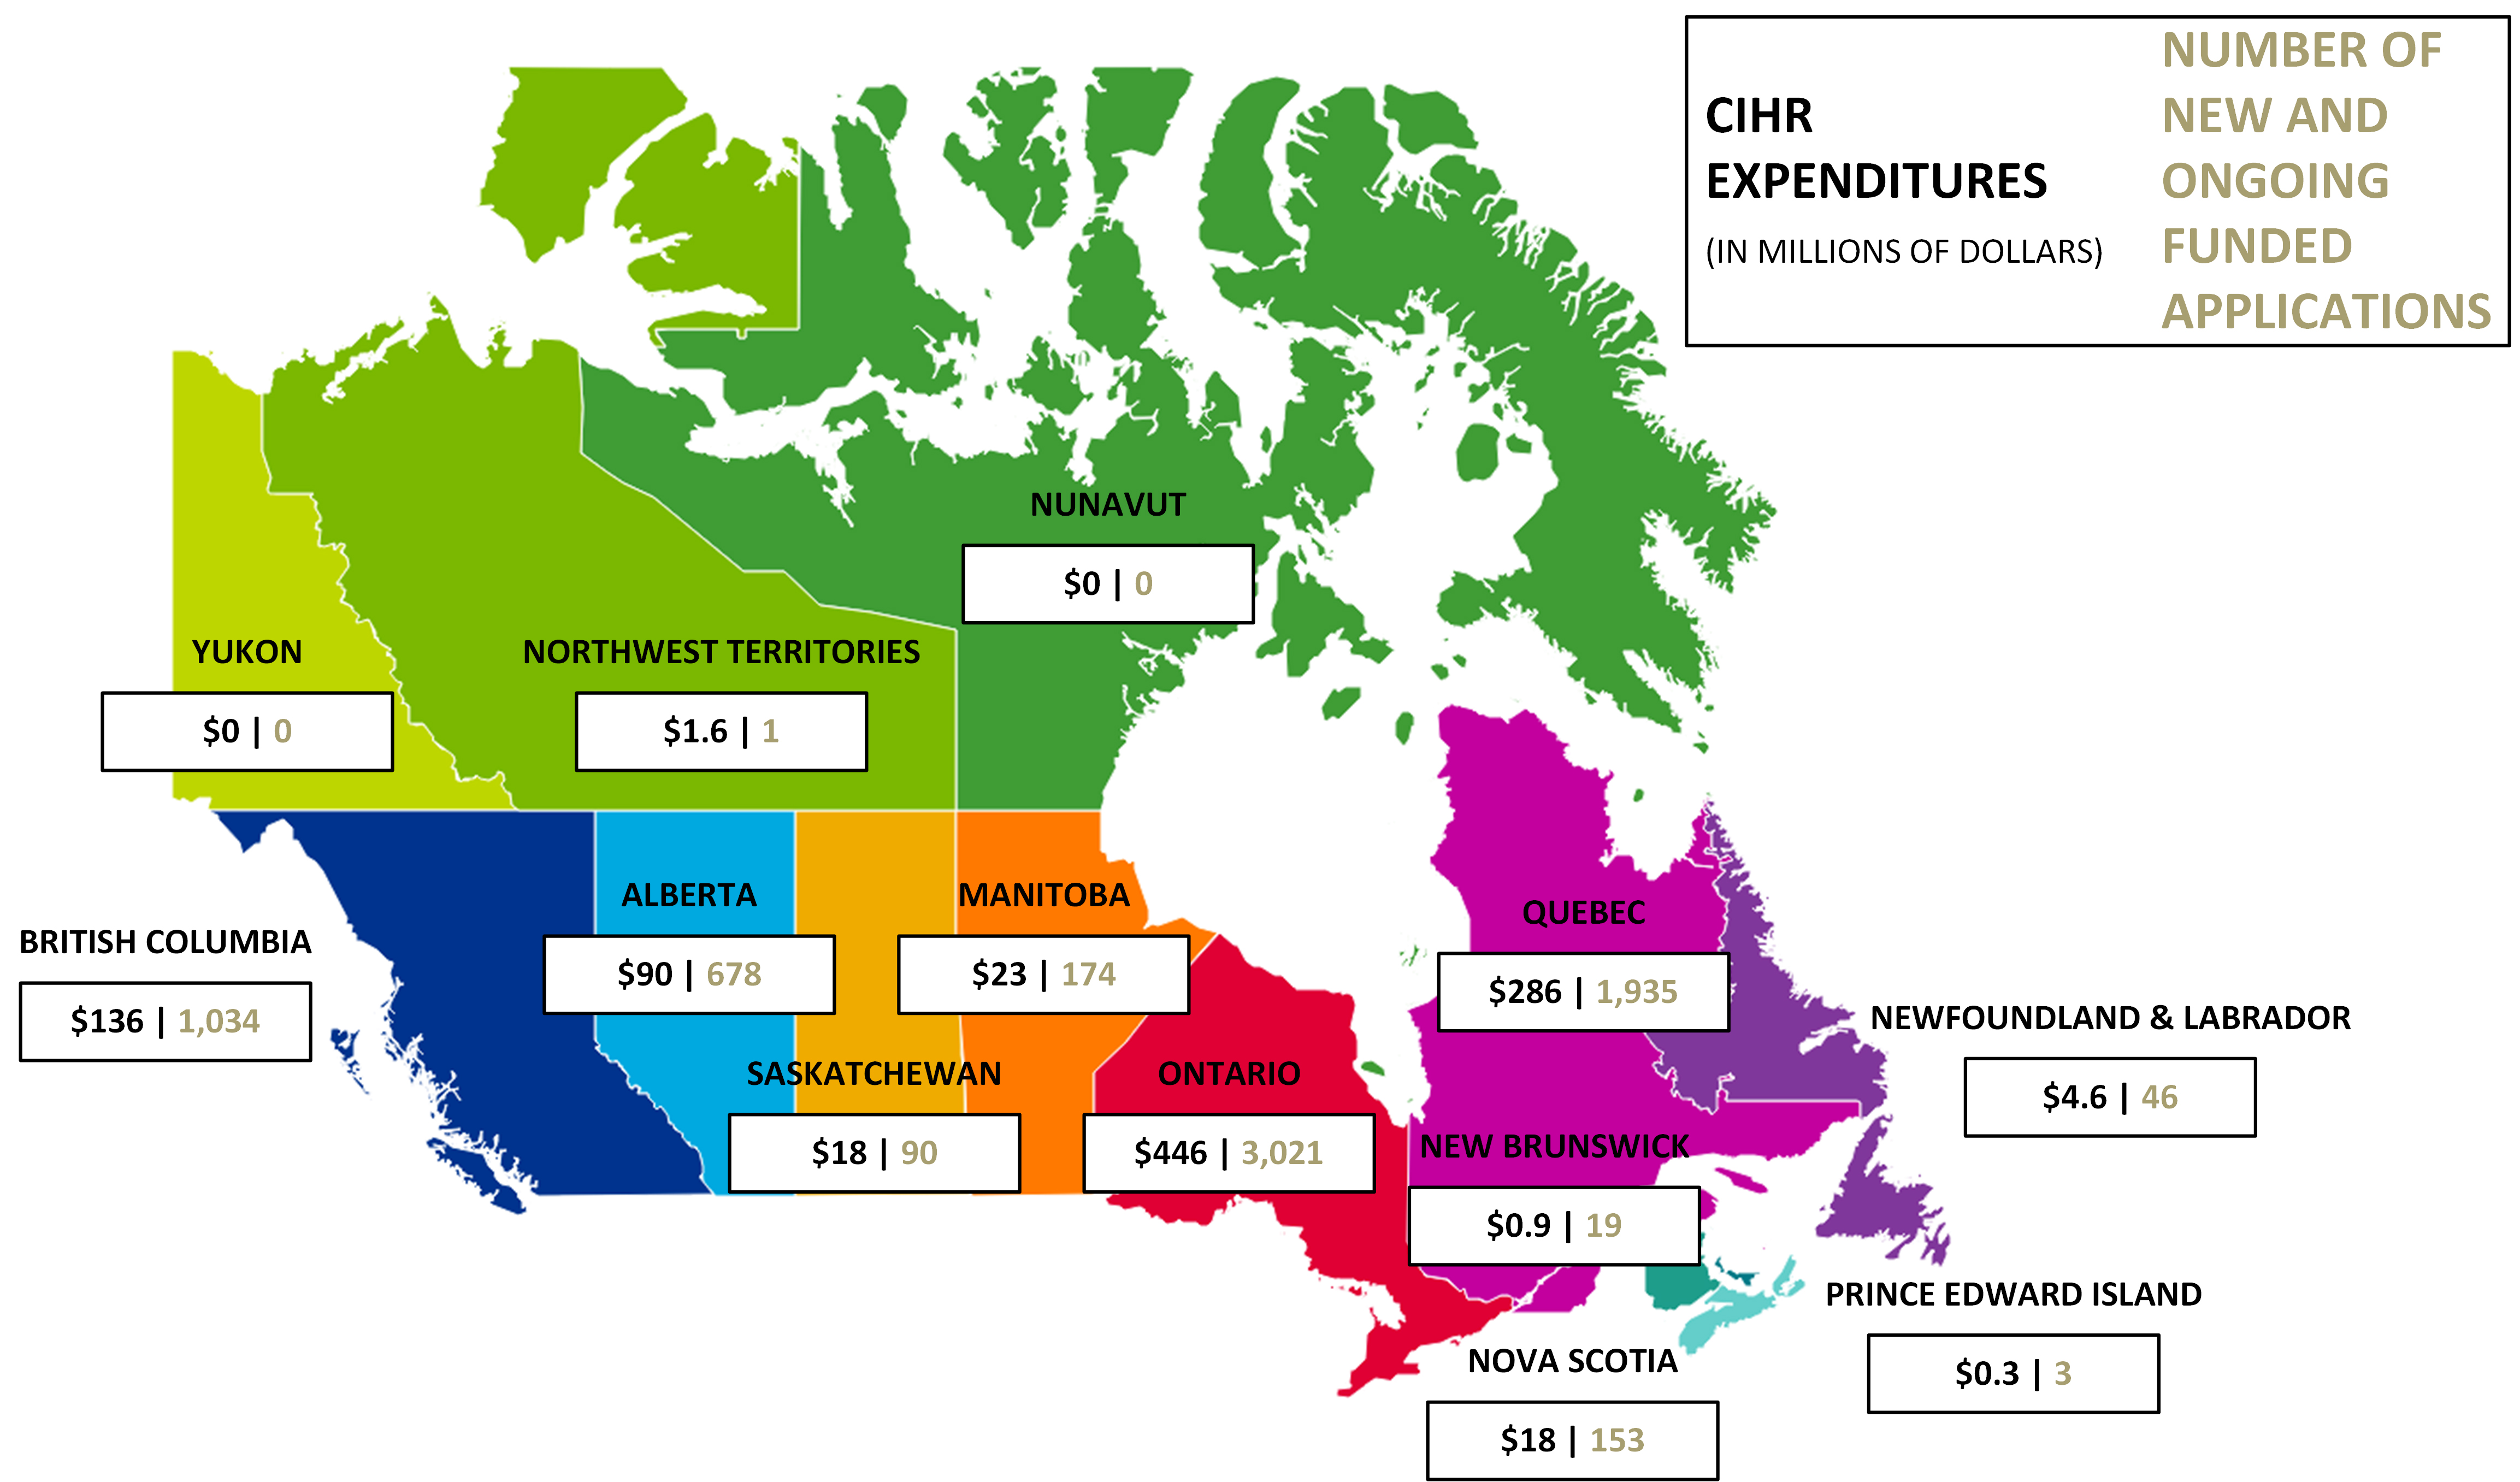
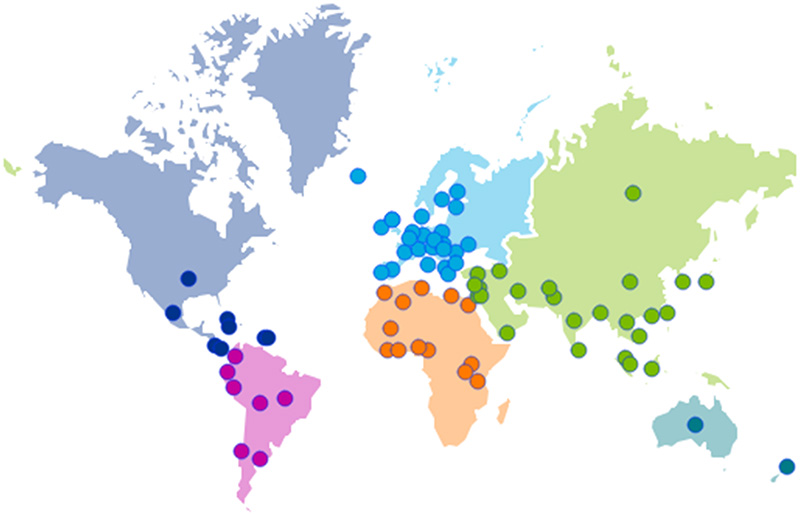
Figure 4: CIHR Investments by Region in 2024-25 (in millions of dollars)
Due to rounding, figures may not reconcile with other published information
Excludes operating expenditures, partner contributions and direct payments
Figure 4 long description
Region
CIHR Expenditures 2024-25
Number of new and ongoing funded applications 2024-25
Alberta
$131
889
British Columbia
$165
1,151
Manitoba
$35
239
New Brunswick
$2.3
24
Newfoundland & Labrador
$4.8
40
Northwest Territories
$2.3
6
Nova Scotia
$33
208
Nunavut
$2.1
4
Ontario
$595
3,737
Prince Edward Island
$0.2
4
Quebec
$332
2,215
Saskatchewan
$19
123
Yukon
$1.4
4
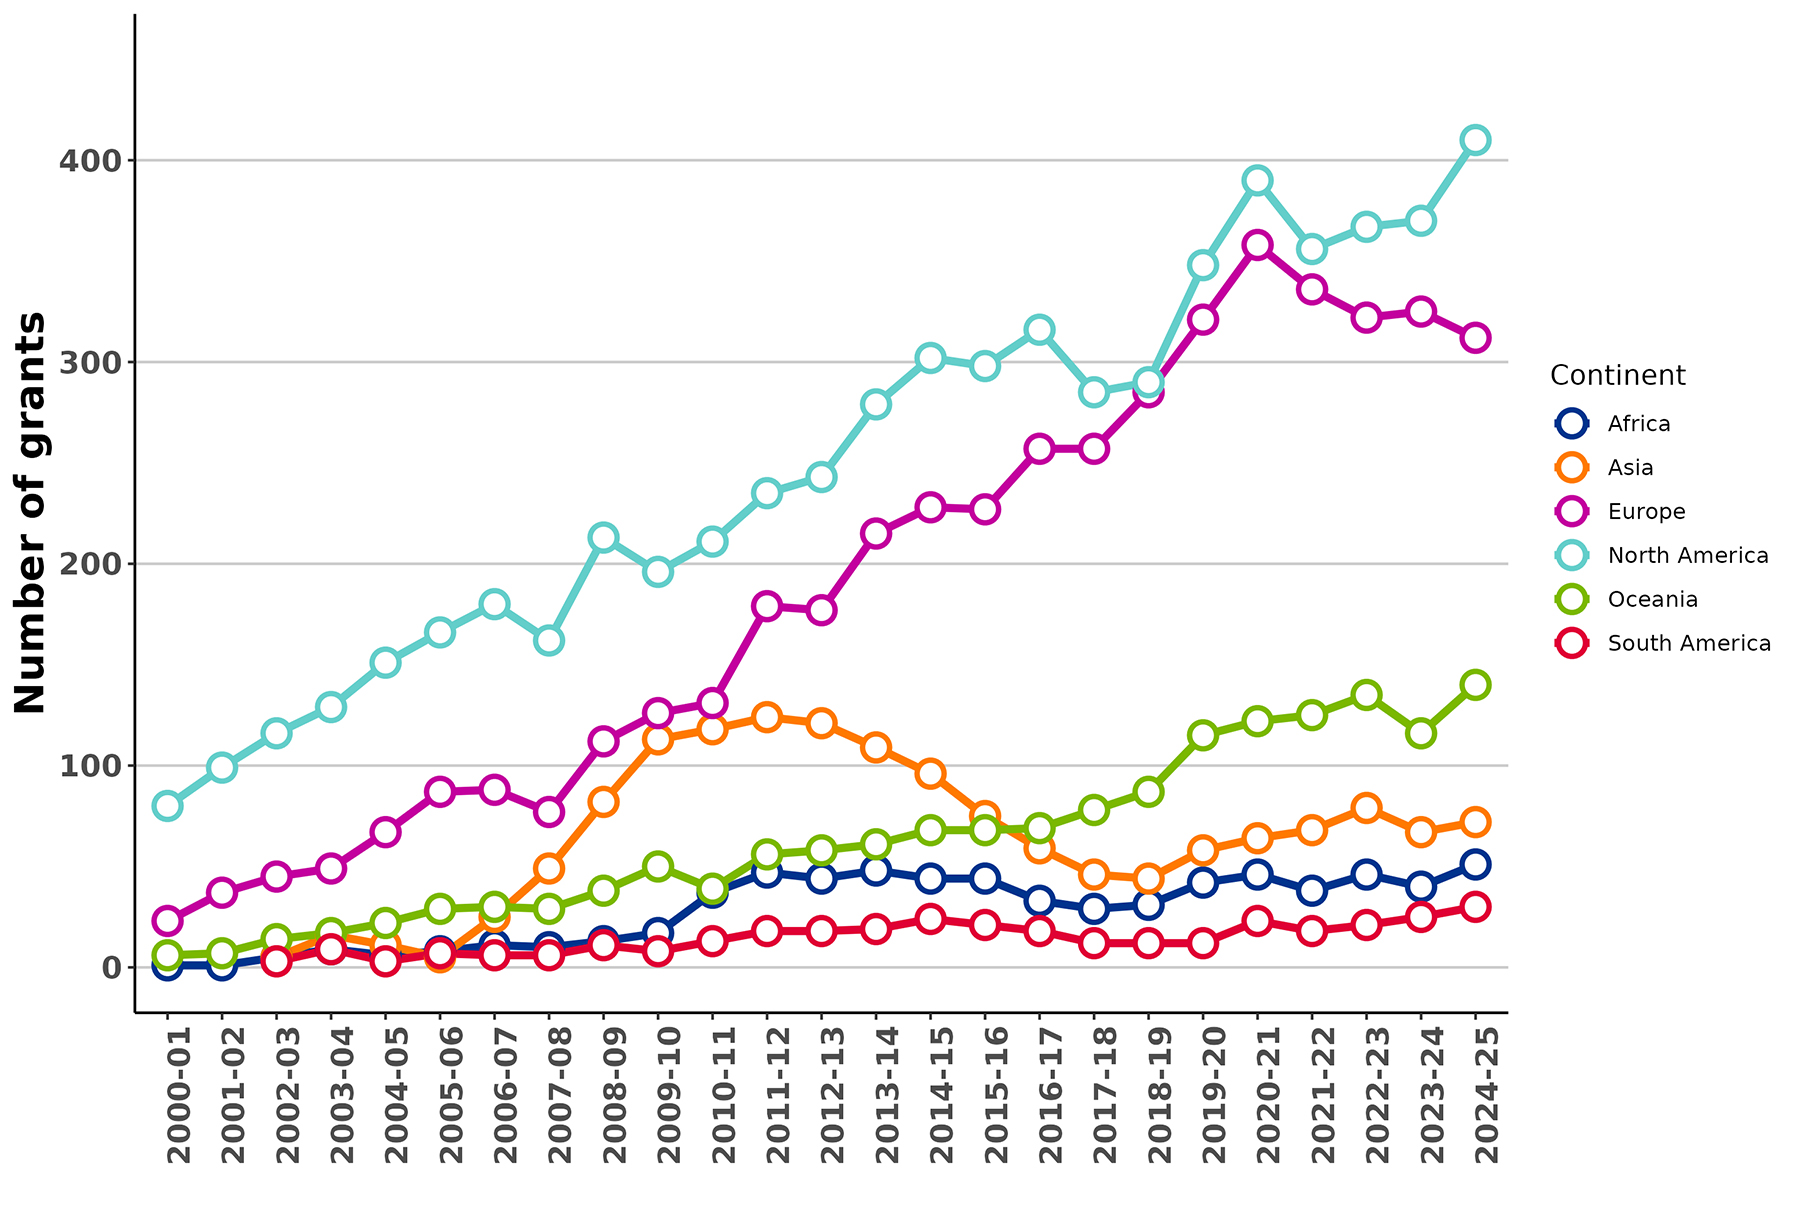
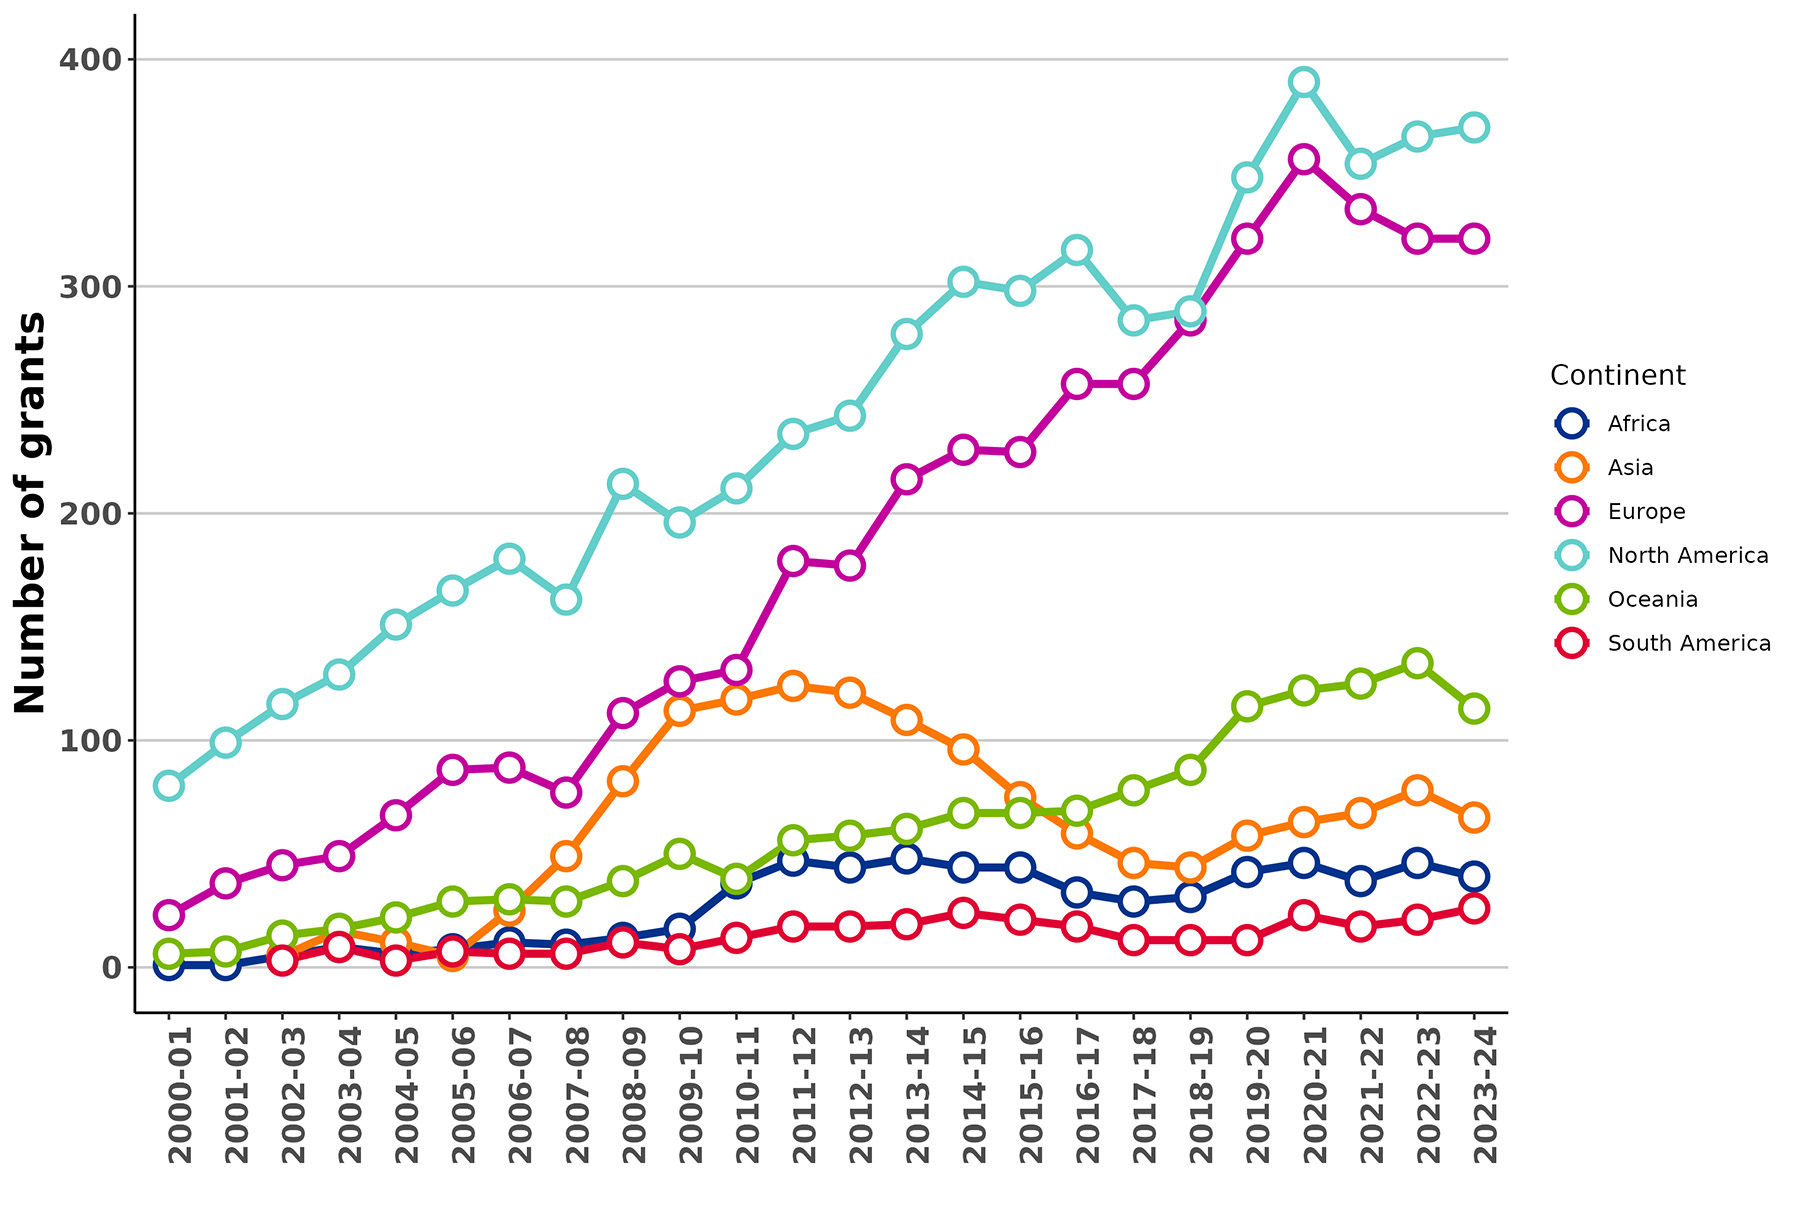
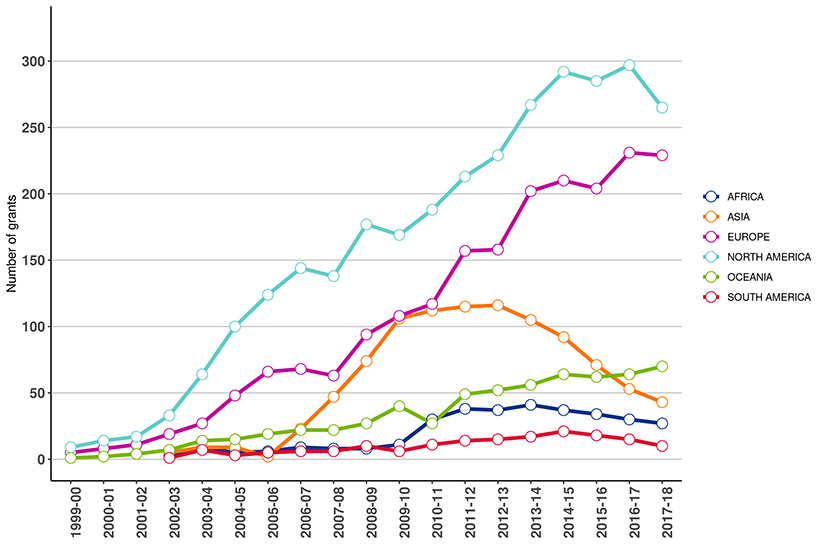
Figure 5a: Number of New and Ongoing Projects
Due to rounding as well as changes in methodology, figures may not reconcile with other published information.
Excludes operating expenditures and partner contributions.
As of March 2021, an updated method is used to determine international collaborators based on affiliations at the time of grant submission.
Figure 5a long description
Continent
2000-01
2001-02
2002-03
2003-04
2004-05
2005-06
2006-07
2007-08
2008-09
2009-10
2010-11
2011-12
2012-13
2013-14
2014-15
2015-16
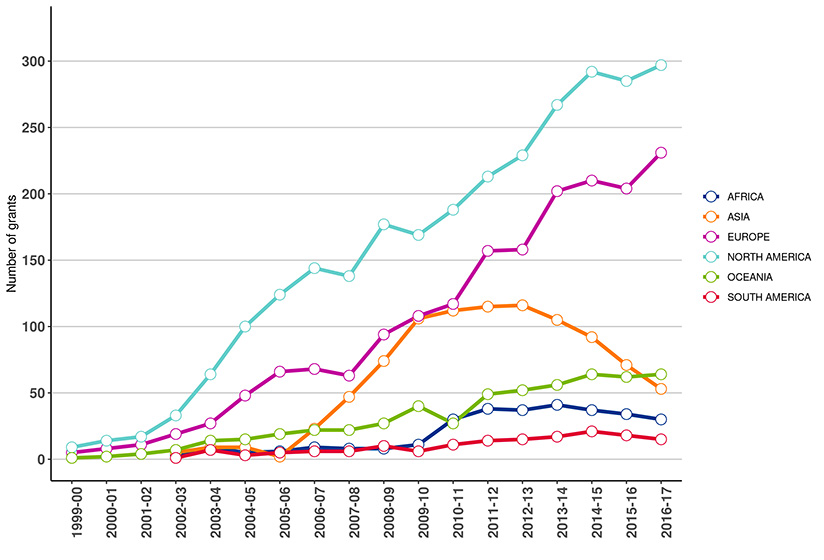
2016-17
2017-18
2018-19
2019-20
2020-21
2021-22
2022-23
2023-24
2024-25
Africa
1
1
5
9
6
8
11
10
13
17
37
47
44
48
44
44
33
29
31
42
46
38
46
40
51
Europe
23
37
45
49
67
87
88
77
112
126
131
179
177
215
228
227
257
257
285
321
358
336
322
325
312
North America
80
99
116
129
151
166
180
162
213
196
211
235
243
279
302
298
316
285
290
348
390
356
367
370
410
Oceania
6
7
14
17
22
29
30
29
38
50
39
56
58
61
68
68
69
78
87
115
122
125
135
116
140
Asia
0
0
5
16
11
5
25
49
82
113
118
124
121
109
96
75
59
46
44
58
64
68
79
67
72
South America
0
0
3
9
3
7
6
6
11
8
13
18
18
19
24
21
18
12
12
12
23
18
21
25
30
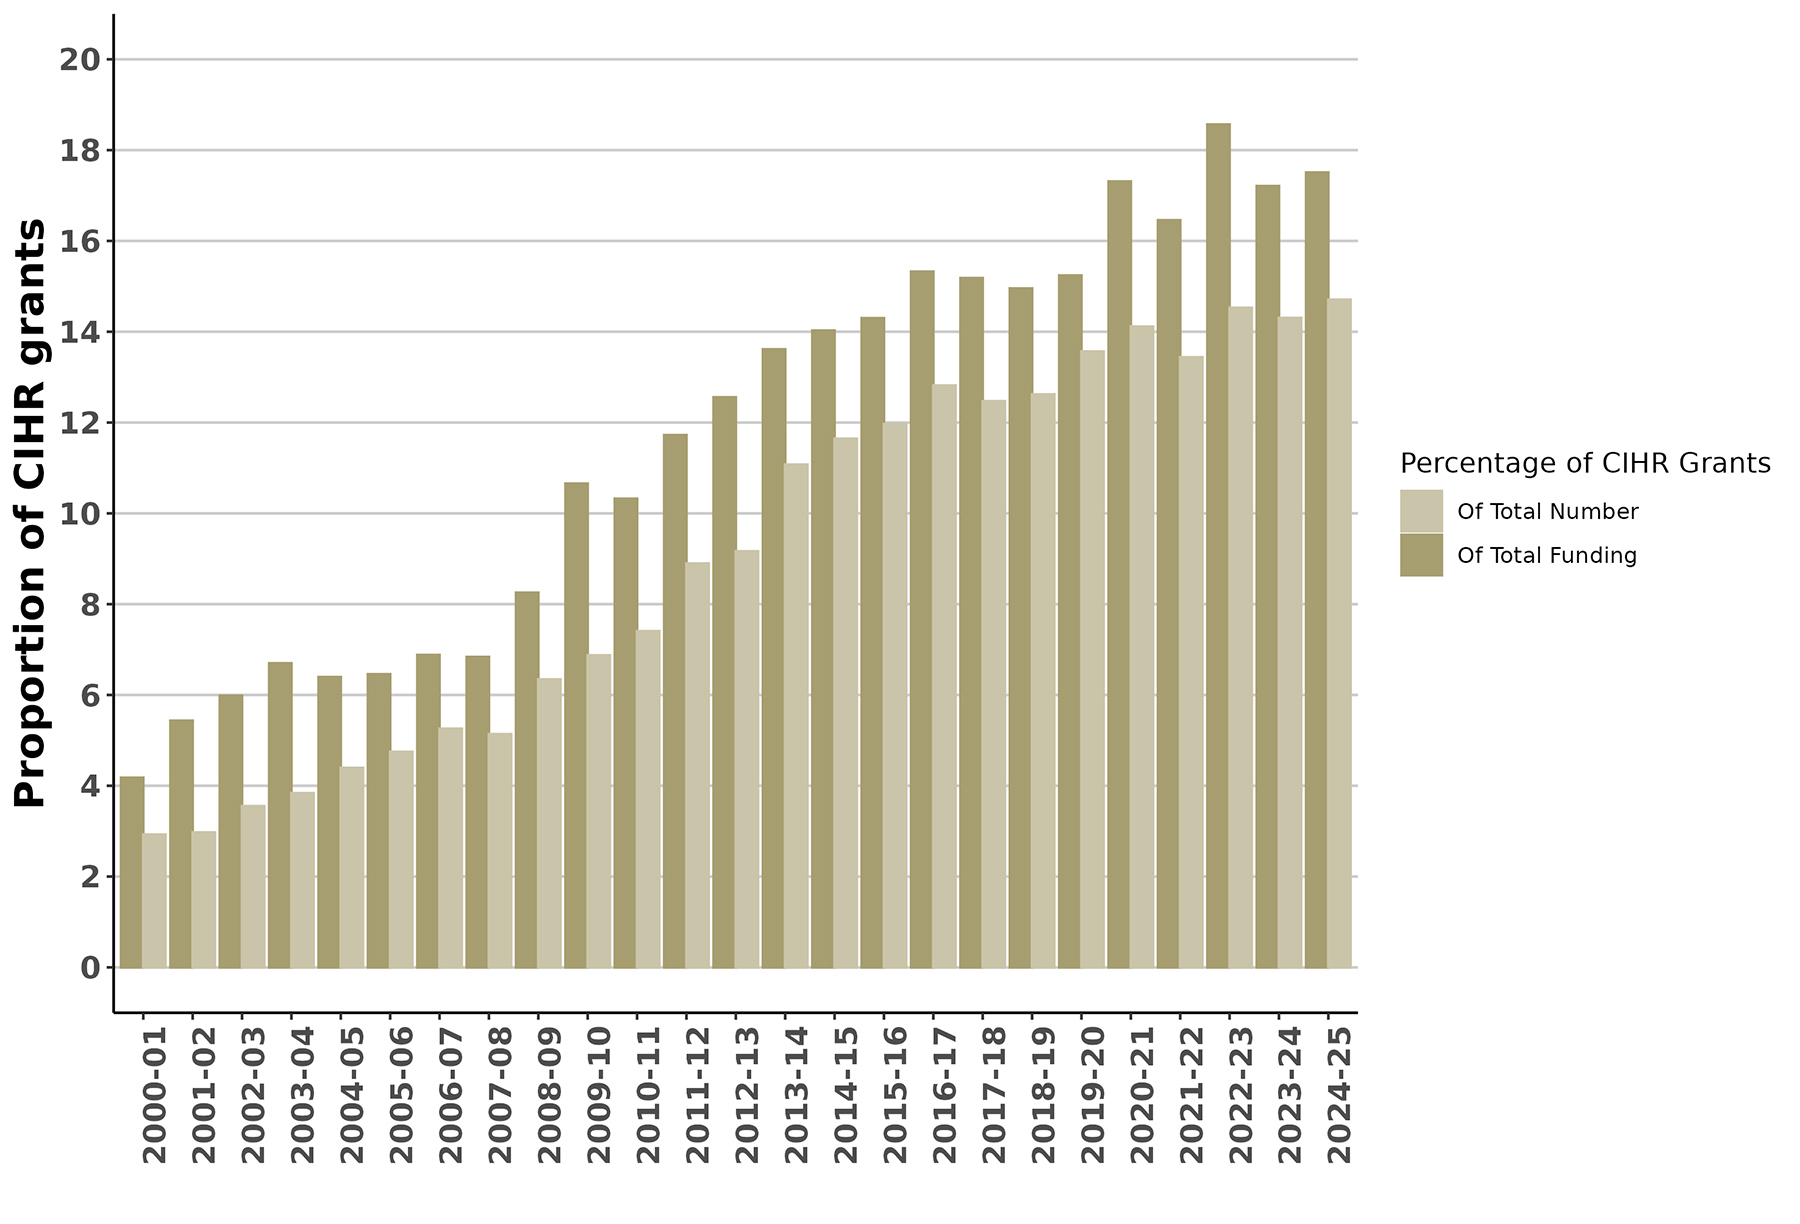
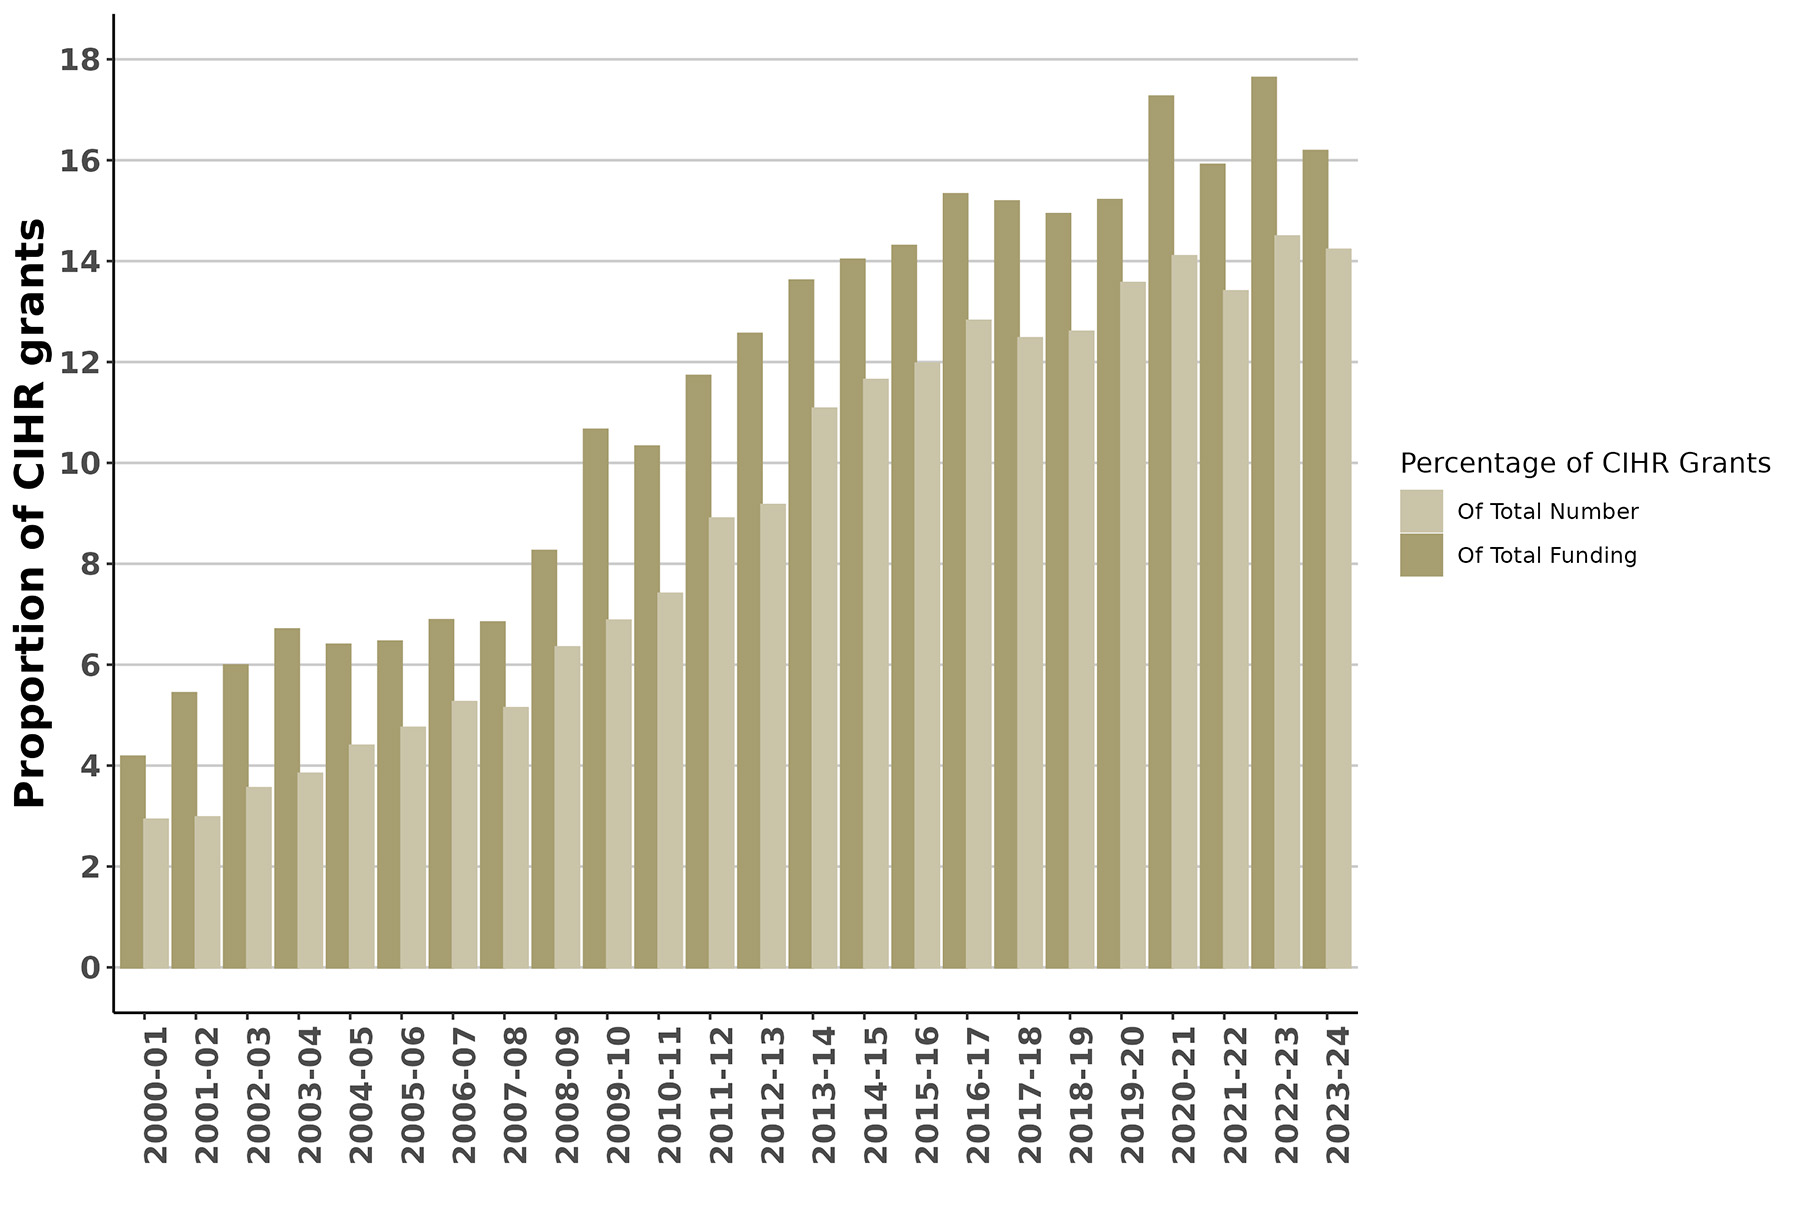
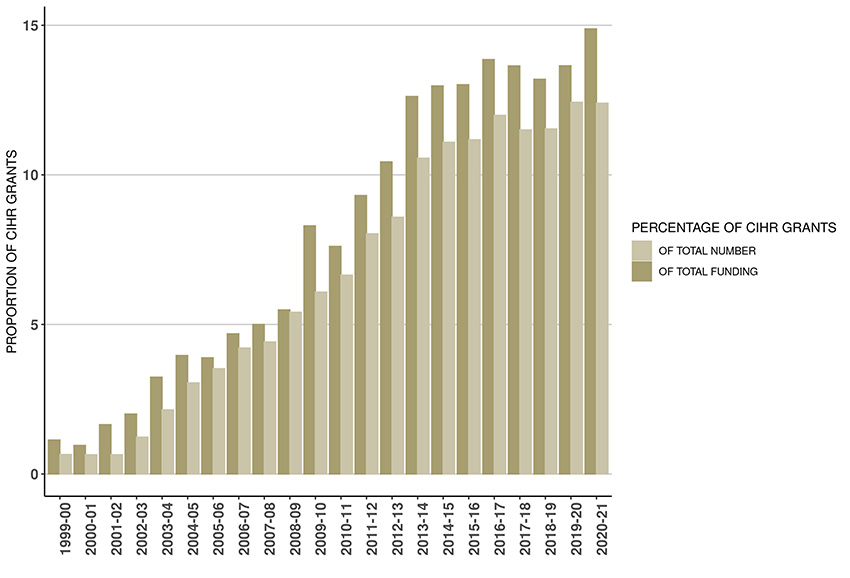
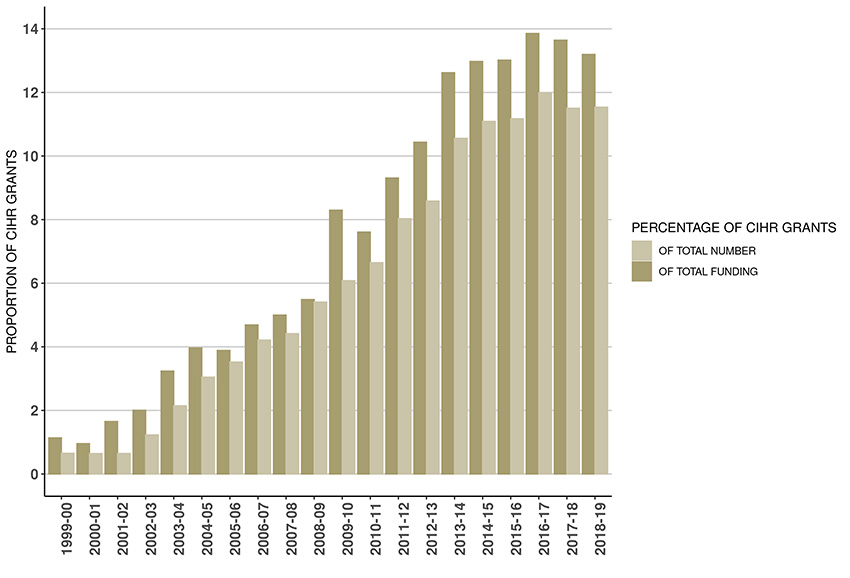
Figure 5b: Proportion of CIHR Grants with International linkages since 2000-01
Due to rounding as well as changes in methodology, figures may not reconcile with other published information.
Excludes operating expenditures and partner contributions.
As of March 2021, an updated method is used to determine international collaborators based on affiliations at the time of grant submission.
Figure 5b long description
Proportion
2000-01
2001-02
2002-03
2003-04
2004-05
2005-06
2006-07
2007-08
2008-09
2009-10
2010-11
2011-12
2012-13
2013-14
2014-15
2015-16
2016-17
2017-18
2018-19
2019-20
2020-21
2021-22
2022-23
2023-24
2024-25
Percentage of total CIHR investments
4.2%
5.4%
6.0%
6.7%
6.4%
6.5%
6.9%
6.8%
8.3%
10.7%
10.3%
11.7%
12.6%
13.6%
14.0%
14.3%
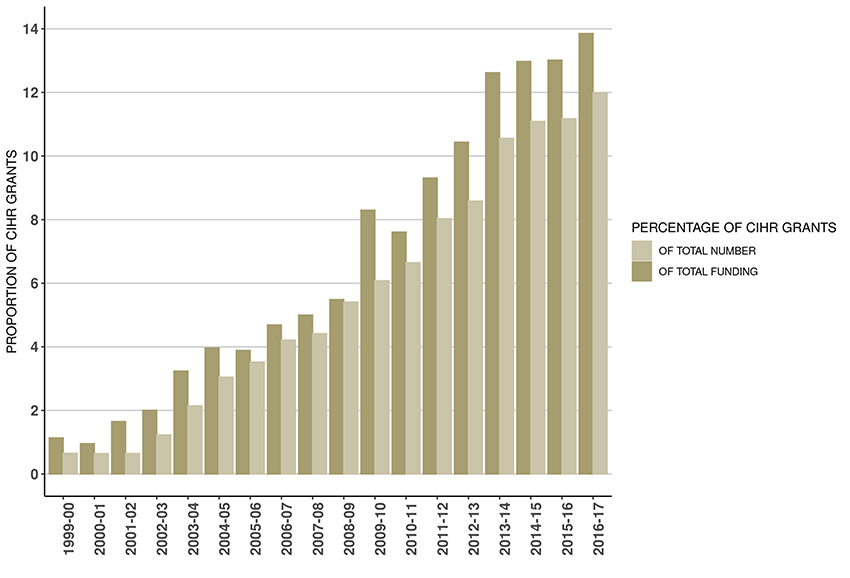
15.3%
15.2%
15.0%
15.2%
17.3%
16.5%
18.6%
17.2%
17.5%
Percentage of total # of CIHR grants
2.9%
3.0%
3.6%
3.8%
4.4%
4.7%
5.3%
5.1%
6.3%
6.9%
7.4%
8.9%
9.2%
11.1%
11.6%
12.0%
12.8%
12.5%
12.6%
13.6%
14.1%
13.4%
14.5%
14.3%
14.7%
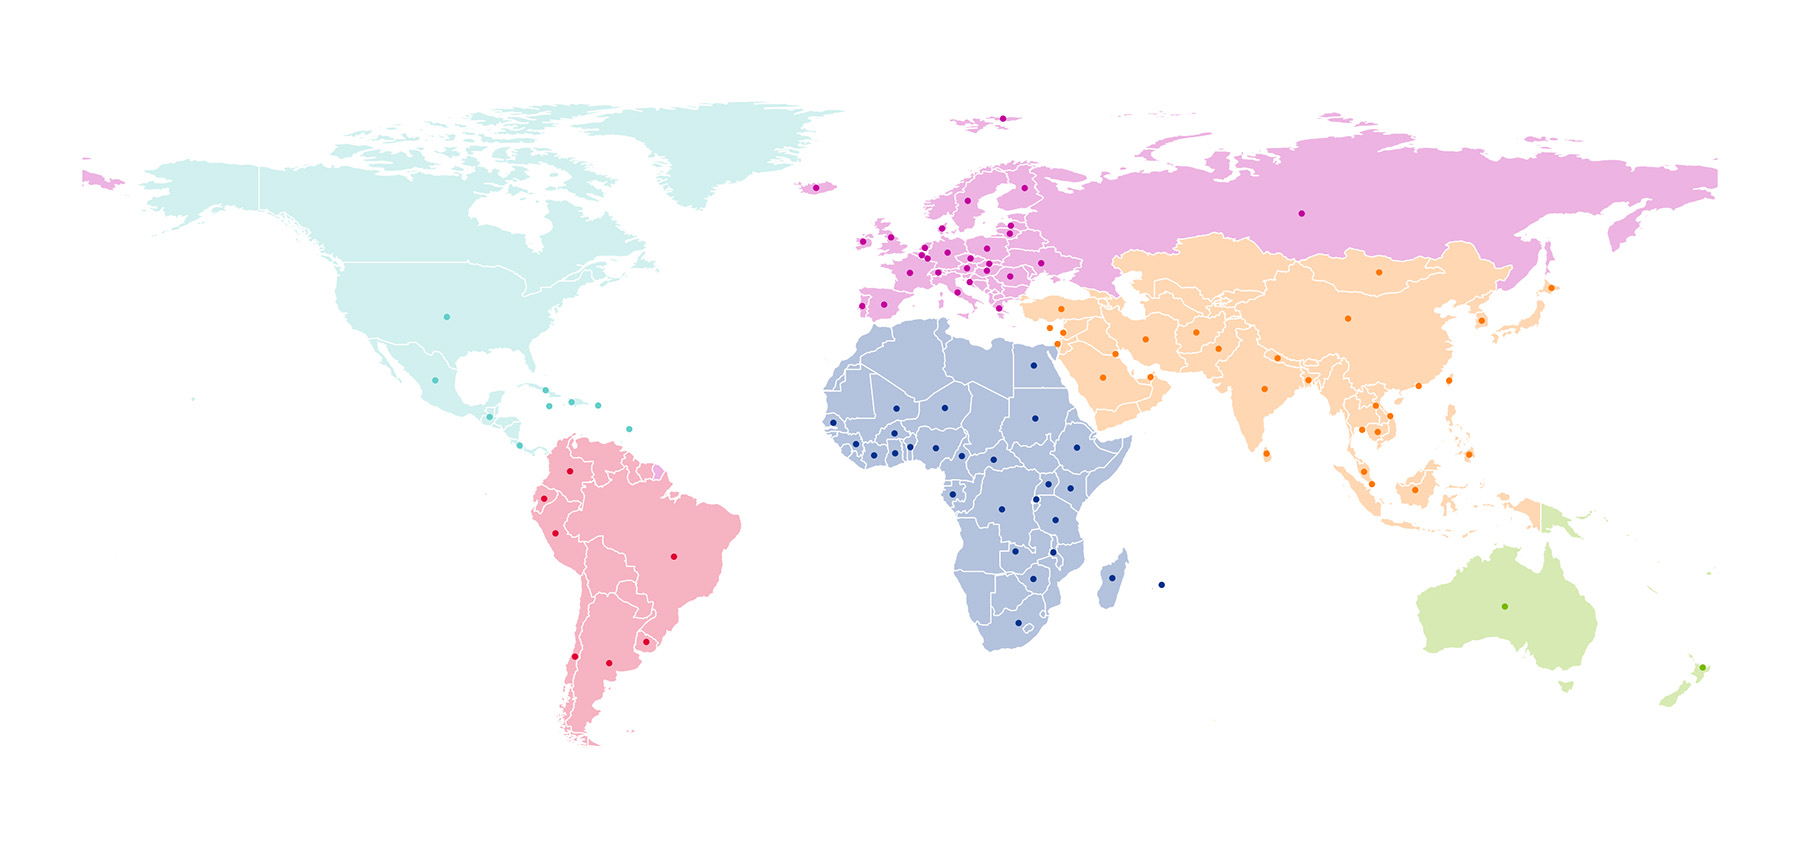
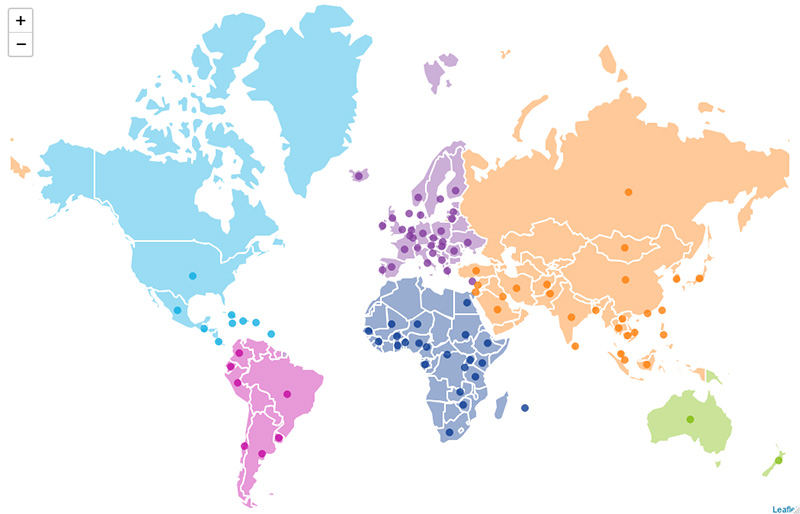
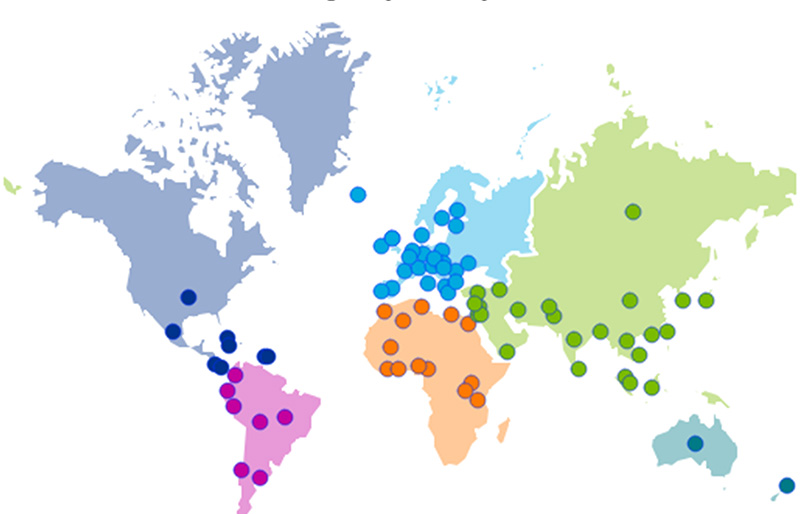
Figure 6: Countries with an International Linkage to a CIHR grants since 2000-01
Due to changes in methodology, figures may not reconcile with other published information
Figure 6 long description
Countries
Afghanistan
Germany
Mauritius
Argentina
Ghana
Mexico
Australia
Greece
Mongolia
Austria
Guatemala
Nepal
Bangladesh
Guinea
Netherlands
Barbados
Haiti
New Zealand
Belgium
Hong Kong
Niger
Benin
Hungary
Nigeria
Brazil
Iceland
Norway
Burkina Faso
India
Pakistan
Cambodia
Indonesia
Peru
Cameroon
Iran
Philippines
Central African Republic
Ireland
Poland
Chile
Israel
Portugal
China
Italy
Puerto Rico
Colombia
Jamaica
Romania
Costa Rica
Japan
Russia
Croatia
Kenya
Rwanda
Cuba
Kuwait
Saudi Arabia
Cyprus
Kyrgyzstan
Senegal
Czhech Republic
Lao People's Democratic Republic
Singapore
Côte d'Ivoire
Latvia
Slovakia
Democratic Republic of the Congo
Lebanon
South Africa
Denmark
Lithuania
South Korea
Ecuador
Luxembourg
Spain
Egypt
Madagascar
Sri Lanka
Ethiopia
Malawi
Sudan
Finland
Malaysia
Sweden
France
Mali
Switzerland
Gabon
Malta
Taiwan
Tanzania
Thailand
Turkey
Uganda
Ukraine
United Arab Emirates
United Kingdom
United States of America
Uruguay
Vietnam
Zambia
Zimbabwe
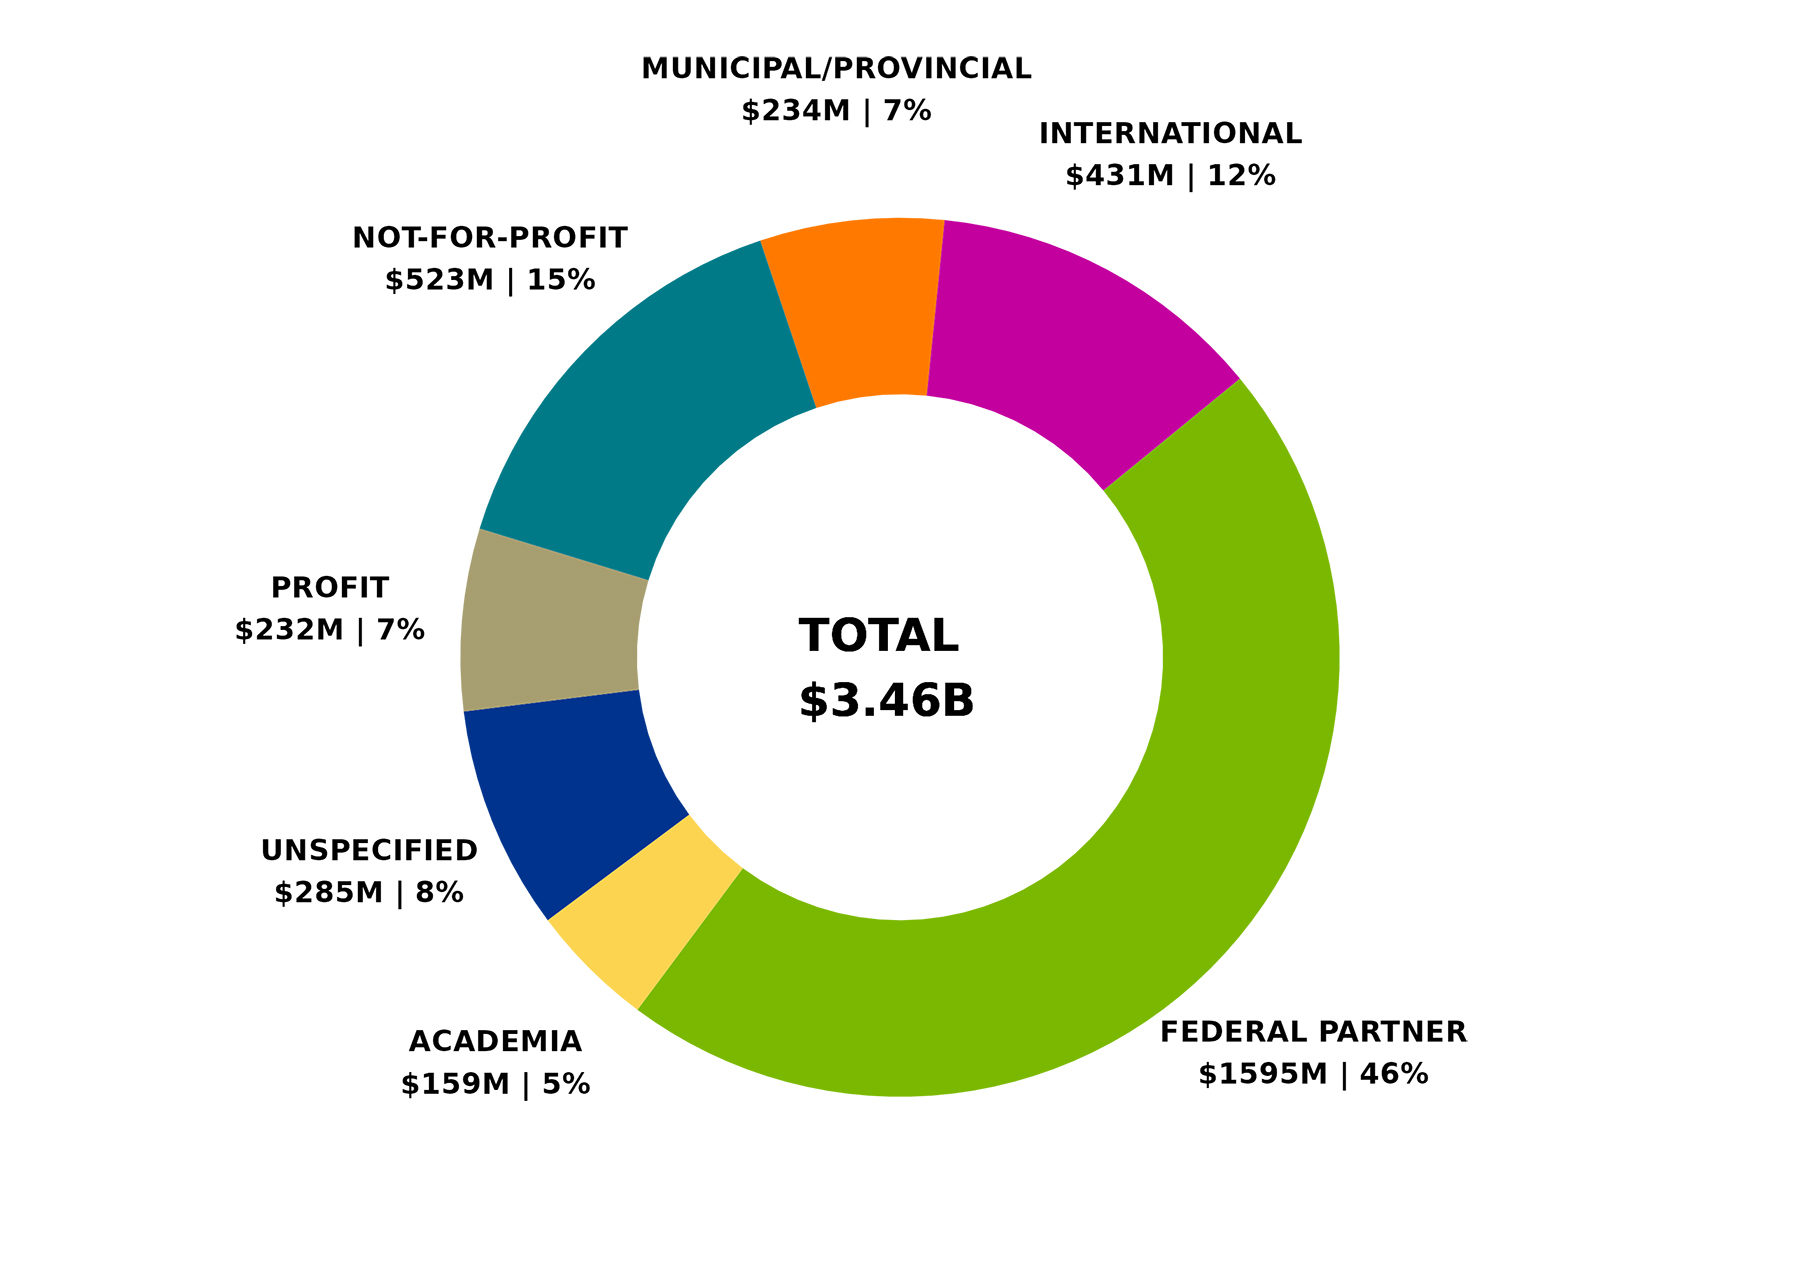
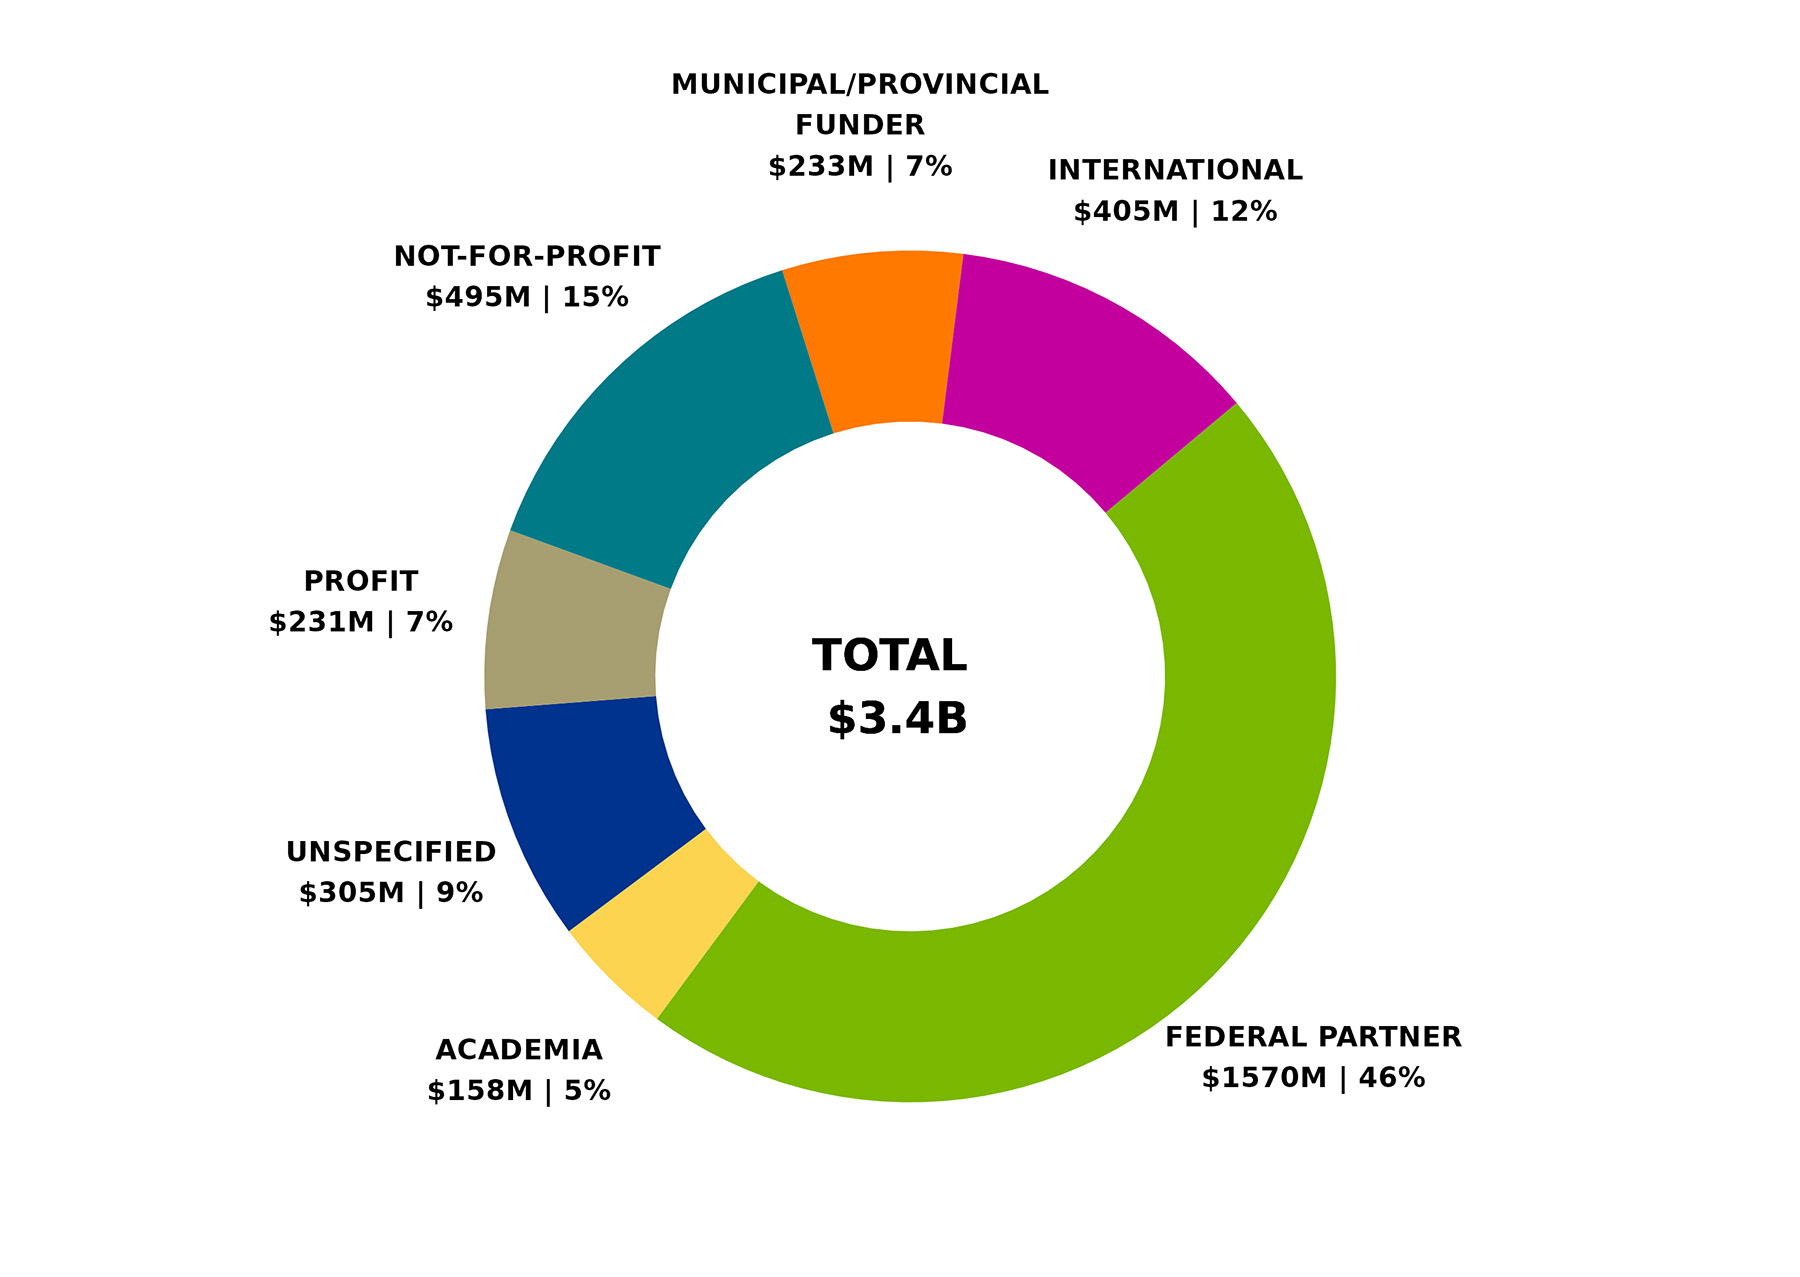
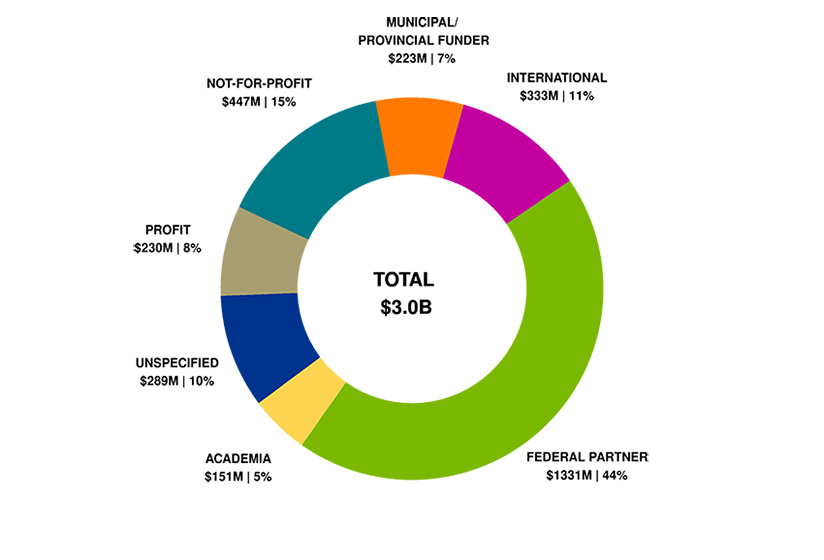
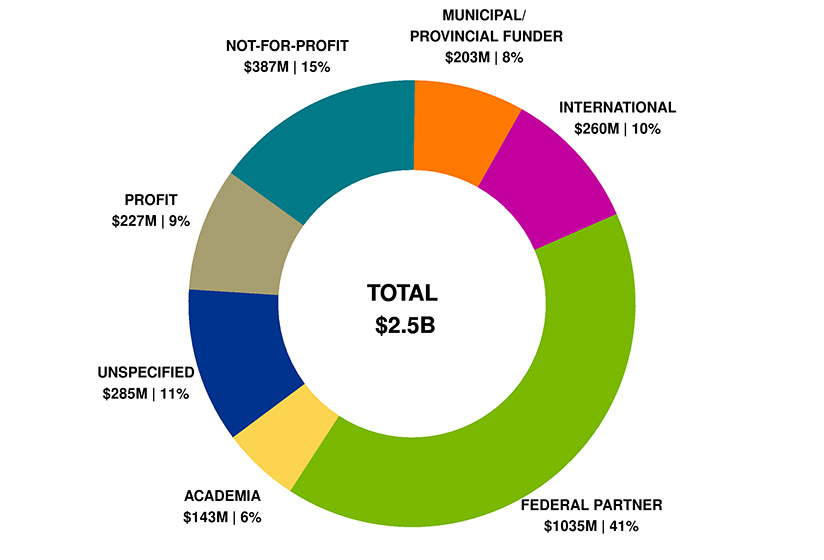
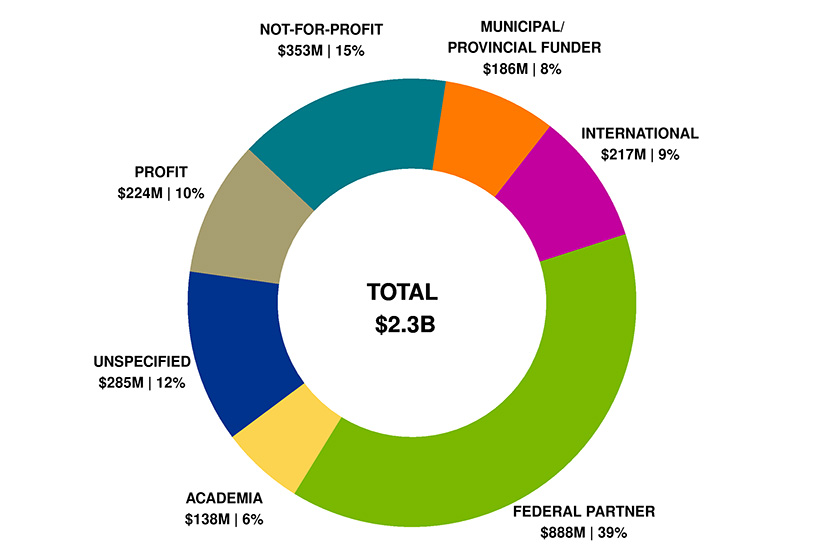
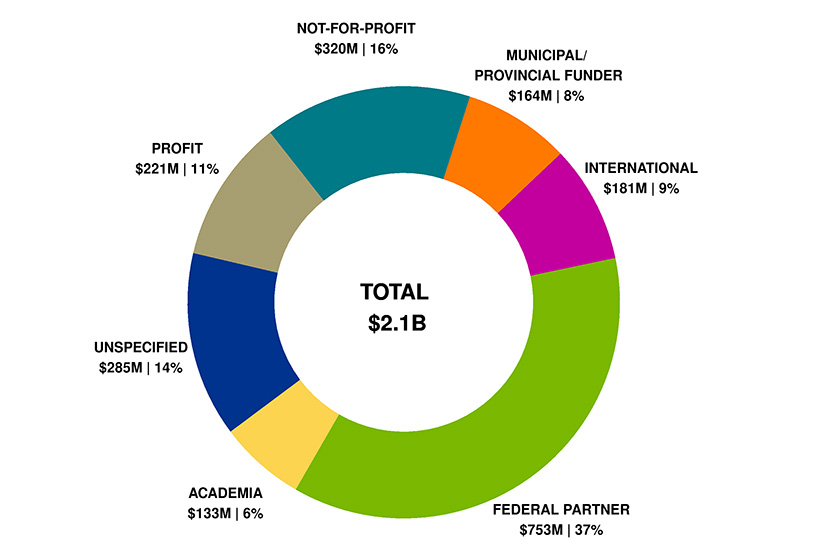
Figure 7: Leveraged Partner Funding by Sector (in millions of dollars) – Cumulative totals from 2000-01 to 2024-25
Due to rounding, figures may not reconcile with other published information
Includes partner contributions administered by CIHR, in kind and direct contributions from partner directly to the researcher
Includes both competition and applicant partner contributions where there may or may not be a formal agreement with CIHR
Figure 7 long description
Sector
Total
Percentage
Academia
$159
4.6%
Federal partners
$1,595
46.1%
International
$431
12.5%
Municipal/Provincial funder
$234
6.8%
Not-for-profit
$523
15.1%
Profit
$232
6.7%
Unspecified
$285
8.2%
Total
$3,460
100%
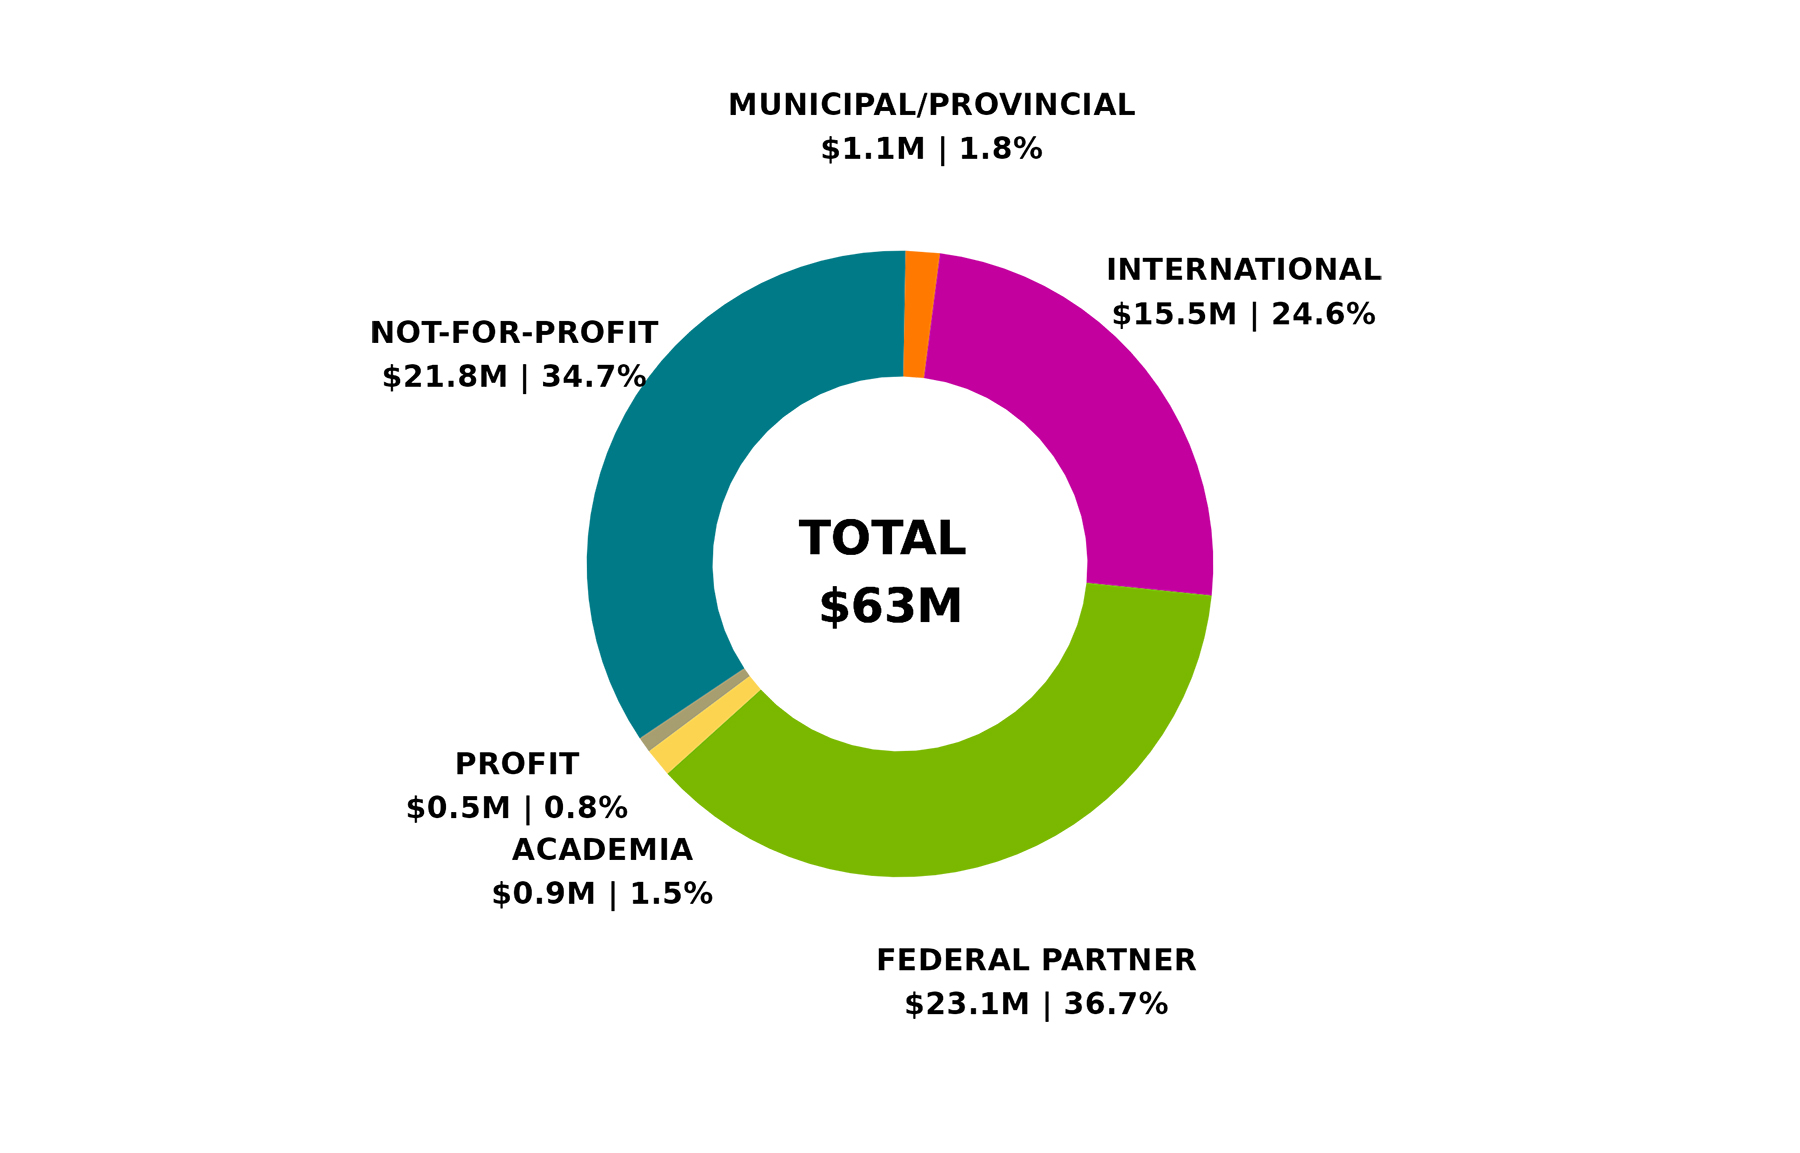
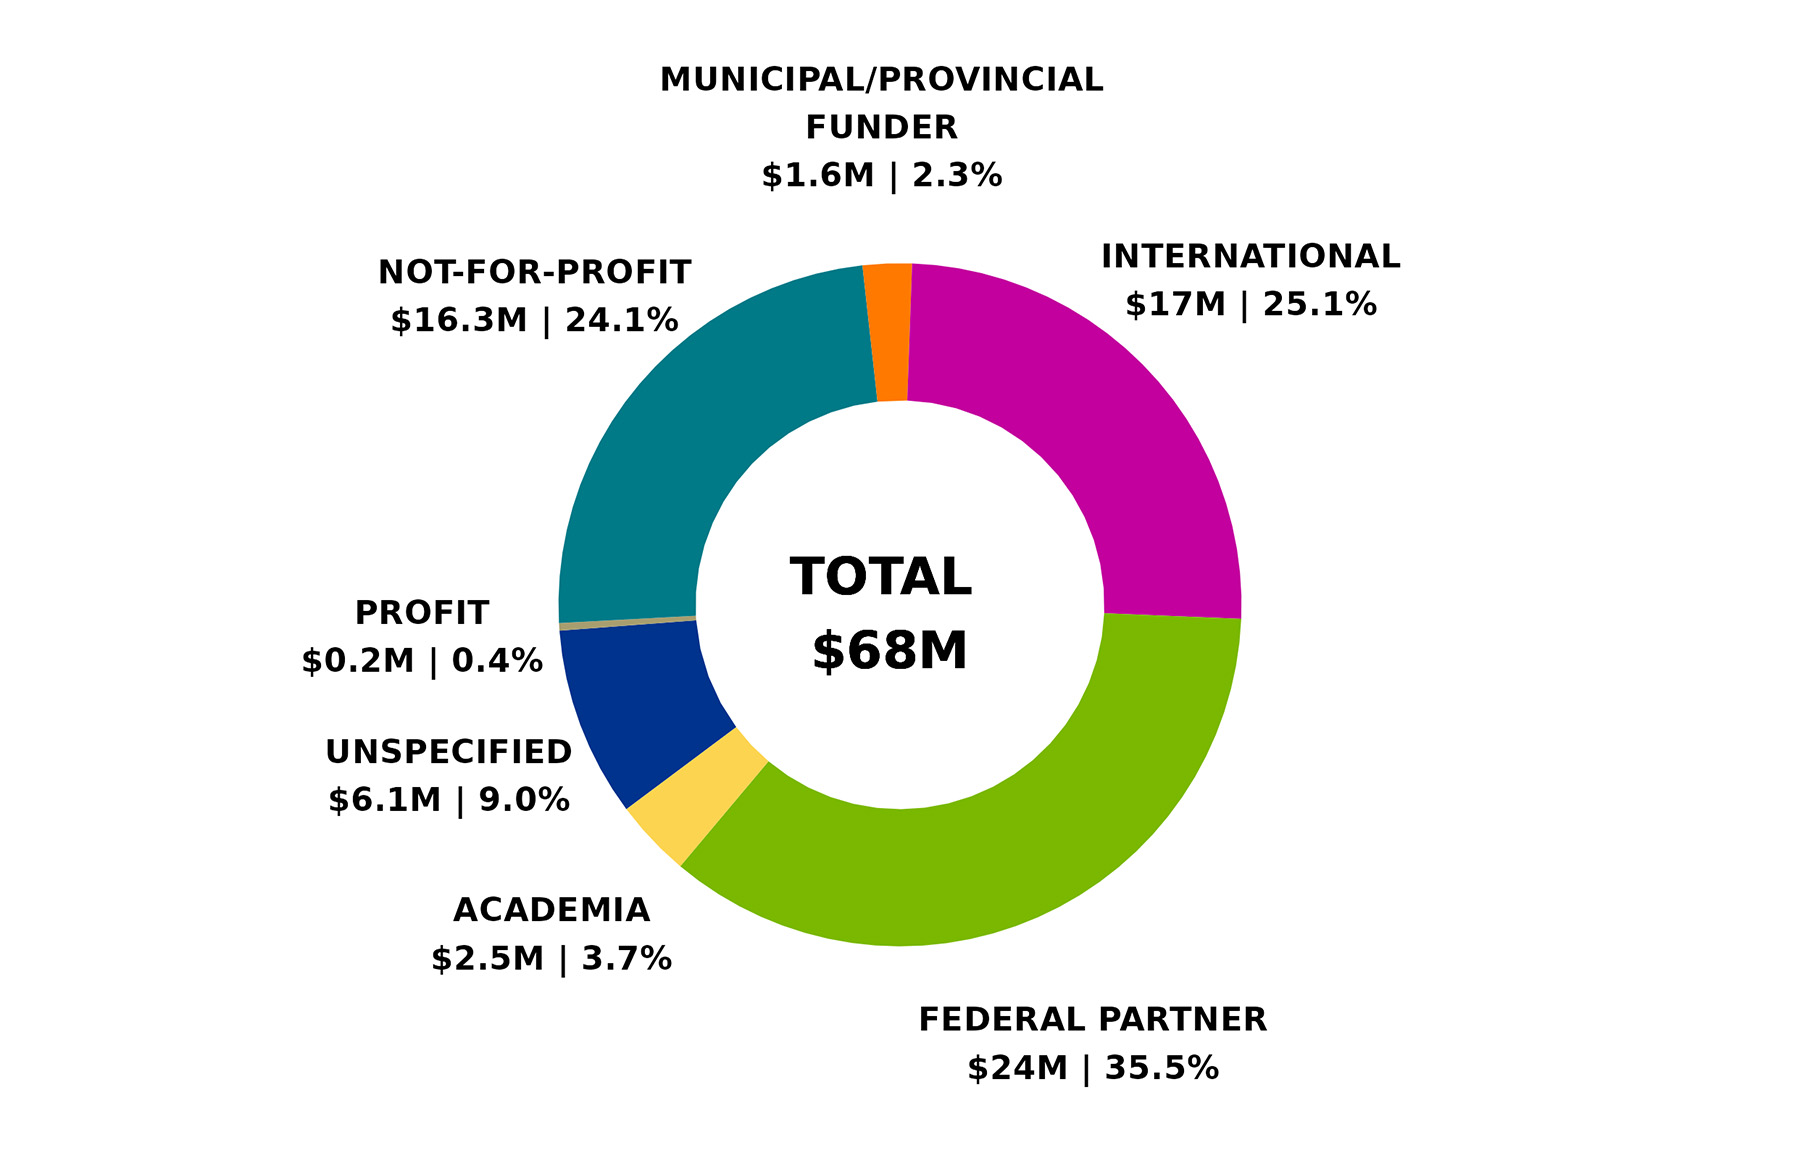
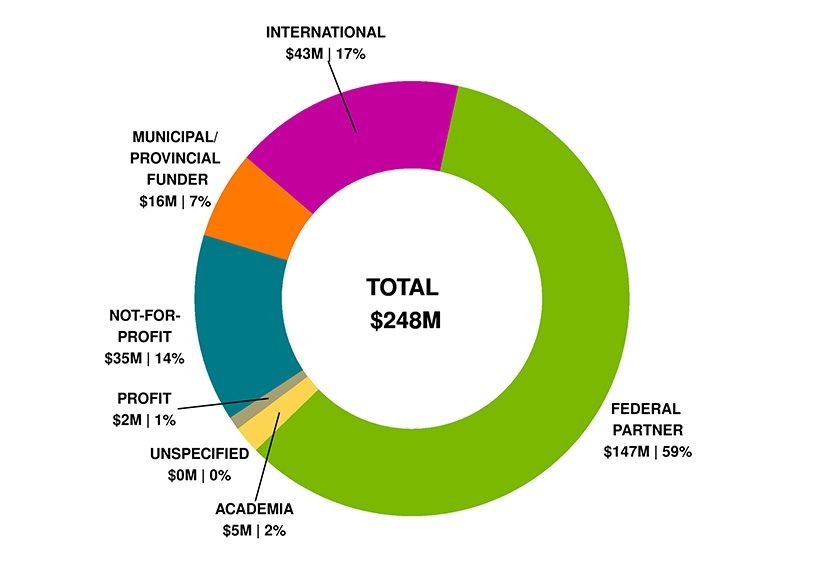
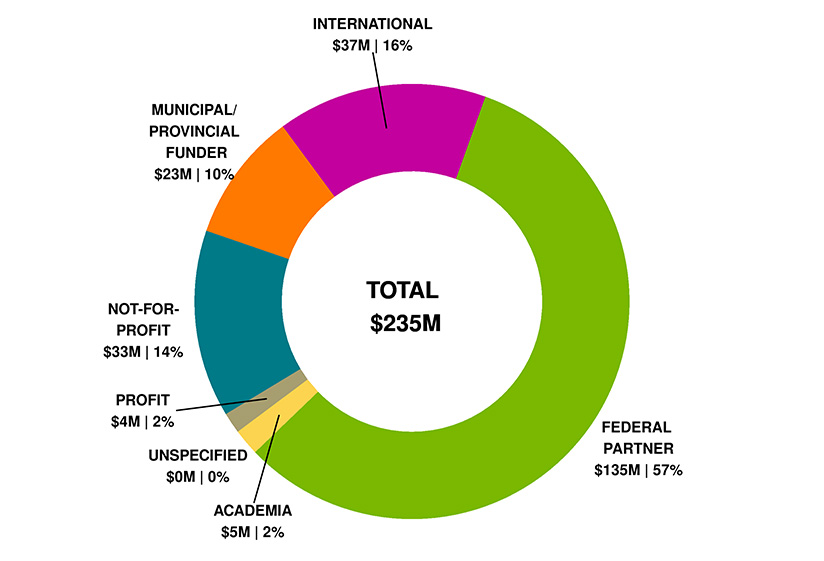
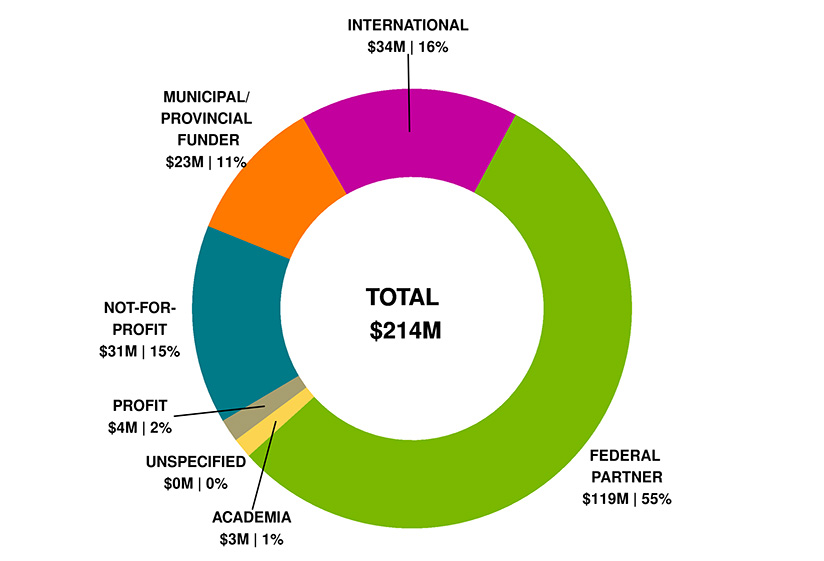
Figure 8: Leveraged Partner Funding by Sector (in millions of dollars) – 2024-25
Due to rounding, figures may not reconcile with other published information
Includes partner contributions administered by CIHR, in kind and direct contributions from partner directly to the researcher
Includes both competition and applicant partner contributions where there may or may not be a formal agreement with CIHR
Starting in 2024-25, partner institutions previously categorized as “Unspecified” in figures 7 and 8 have been re-classified into their associated sectors
Figure 8 long description
Sector
Total
Percentage
Academia
$0.9M
1.5%
Federal partner
$23.1M
36.7%
International
$15.5M
24.6%
Municipal/Provincial funder
$1.1M
1.8%
Not-for-profit
$21.8M
34.7%
Profit
$0.5M
0.8%
Total
$63.0M
100%
2023-2024
Figure 1: CIHR Fiscal Year Investments by Primary Theme since 2000-01 (in millions of dollars)
Due to rounding, figures may not reconcile with other published information
Excludes operating expenditures and partner contributions
Primary theme designation is determined by the grantee at the time of application
Figure 1 long description
Primary theme
2000-01
2001-02
2002-03
2003-04
2004-05
2005-06
2006-07
2007-08
2008-09
2009-10
2010-11
2011-12
2012-13
2013-14
2014-15
2015-16
2016-17
2017-18
2018-19
2019-20
2020-21
2021-22
2022-23
2023-24
Biomedical
$160
$250
$312
$354
$381
$419
$439
$444
$474
$463
$475
$458
$455
$454
$471
$459
$478
$472
$500
$510
$643
$559
$522
$530
Clinical
$27
$47
$64
$69
$77
$82
$85
$101
$110
$126
$129
$130
$129
$130
$134
$132
$134
$140
$153
$164
$247
$209
$238
$226
Health systems/services
$5
$16
$25
$32
$36
$36
$34
$42
$48
$56
$58
$57
$64
$61
$67
$73
$82
$81
$86
$94
$120
$148
$147
$148
Social/Cultural/Environmental/Population Health
$9
$25
$38
$48
$57
$60
$69
$84
$85
$91
$91
$91
$92
$90
$90
$82
$83
$91
$92
$108
$160
$155
$128
$126
Not applicable/Specified
$168
$157
$148
$144
$155
$161
$172
$255
$199
$195
$213
$215
$201
$210
$197
$227
$248
$252
$258
$259
$269
$244
$223
$228
Total
$370
$495
$587
$647
$705
$758
$800
$927
$917
$929
$967
$951
$941
$944
$960
$973
$1,024
$1,035
$1,088
$1,135
$1,440
$1,315
$1,258
$1,258
Figure 2: CIHR Investments by Primary Theme 2023-24 (in millions of dollars)
Due to rounding, figures may not reconcile with other published information
Excludes operating expenditures and partner contributions
Primary theme designation is determined by the grantee at the time of application
Figure 2 long description
Primary Theme
2023-24
Percentage Breakdown
Biomedical
$530
42%
Clinical
$226
18%
Health systems/services
$148
12%
Social/Cultural/Environmental/Population Health
$126
10%
Not applicable/Specified
$228
18%
Total
$1,258
100%
Figure 3: CIHR Fiscal Year Investments by Funding Type since 2000-01 (in millions of dollars)
Due to rounding, figures may not reconcile with other published information
Excludes operating expenditures and partner contributions
Figure 3 long description
Funding type
2000-01
2001-02
2002-03
2003-04
2004-05
2005-06
2006-07
2007-08
2008-09
2009-10
2010-11
2011-12
2012-13
2013-14
2014-15
2015-16
2016-17
2017-18
2018-19
2019-20
2020-21
2021-22
2022-23
2023-24
Investigator Initiated
$256
$334
$384
$410
$447
$481
$506
$545
$531
$525
$551
$556
$565
$570
$619
$632
$662
$682
$737
$771
$851
$839
$810
$826
Research in Priority Areas
$59
$97
$138
$174
$194
$215
$232
$321
$326
$331
$316
$311
$301
$302
$269
$276
$300
$294
$294
$304
$523
$417
$382
$362
Training and Career Support
$55
$64
$66
$63
$64
$63
$61
$60
$60
$73
$99
$83
$75
$72
$72
$64
$62
$59
$57
$60
$65
$59
$66
$71
Total
$370
$495
$587
$647
$705
$758
$800
$927
$917
$929
$967
$951
$941
$944
$960
$973
$1,024
$1,035
$1,088
$1,135
$1,440
$1,315
$1,258
$1,258
Figure 4: CIHR Investments by Region in 2023-24 (in millions of dollars)
Due to rounding, figures may not reconcile with other published information
Excludes operating expenditures, partner contributions and direct payments
Figure 4 long description
Region
CIHR Expenditures 2023-24
Number of new and ongoing funded applications 2023-24
Alberta
$126
898
British Columbia
$163
1,108
Manitoba
$30
223
New Brunswick
$1.9
20
Newfoundland & Labrador
$4.9
45
North West Territories
$2.1
5
Nova Scotia
$27
194
Nunavut
$1.5
4
Ontario
$573
3,607
Prince Edward Island
$0.1
3
Quebec
$296
2,112
Saskatchewan
$19
119
Yukon
$1.3
3
Figure 5a: Number of New and Ongoing Projects
Due to rounding as well as changes in methodology, figures may not reconcile with other published information.
Excludes operating expenditures and partner contributions.
As of March 2021, an updated method is used to determine international collaborators based on affiliations at the time of grant submission.
Figure 5a long description
Continent
2000-01
2001-02
2002-03
2003-04
2004-05
2005-06
2006-07
2007-08
2008-09
2009-10
2010-11
2011-12
2012-13
2013-14
2014-15
2015-16
2016-17
2017-18
2018-19
2019-20
2020-21
2021-22
2022-23
2023-24
Africa
1
1
5
9
6
8
11
10
13
17
37
47
44
48
44
44
33
29
31
42
46
38
46
40
Europe
23
37
45
49
67
87
88
77
112
126
131
179
177
215
228
227
257
257
285
321
356
334
321
321
North America
80
99
116
129
151
166
180
162
213
196
211
235
243
279
302
298
316
285
289
348
390
354
366
370
Oceania
6
7
14
17
22
29
30
29
38
50
39
56
58
61
68
68
69
78
87
115
122
125
134
114
Asia
0
0
5
16
11
5
25
49
82
113
118
124
121
109
96
75
59
46
44
58
64
68
78
66
South America
0
0
3
9
3
7
6
6
11
8
13
18
18
19
24
21
18
12
12
12
23
18
21
26
Figure 5b: Proportion of CIHR Grants with International linkages since 2000-01
Due to rounding as well as changes in methodology, figures may not reconcile with other published information.
Excludes operating expenditures and partner contributions.
As of March 2021, an updated method is used to determine international collaborators based on affiliations at the time of grant submission.
Figure 5b long description
Proportion
2000-01
2001-02
2002-03
2003-04
2004-05
2005-06
2006-07
2007-08
2008-09
2009-10
2010-11
2011-12
2012-13
2013-14
2014-15
2015-16
2016-17
2017-18
2018-19
2019-20
2020-21
2021-22
2022-23
2023-24
Percentage of total CIHR investments
4.2%
5.4%
6%
6.7%
6.4%
6.5%
6.9%
6.8%
8.3%
10.7%
10.3%
11.7%
12.6%
13.6%
14%
14.3%
15.3%
15.2%
14.9%
15.2%
17.3%
15.9%
17.6%
16.2%
Percentage of total # of CIHR grants
2.9%
3%
3.6%
3.8%
4.4%
4.7%
5.3%
5.1%
6.3%
6.9%
7.4%
8.9%
9.2%
11.1%
11.6%
12%
12.8%
12.5%
12.6%
13.6%
14.1%
13.4%
14.5%
14.2%
Figure 6: Countries with an International Linkage to a CIHR grants since 2000-01
Due to changes in methodology, figures may not reconcile with other published information
Figure 6 long description
Countries
Afghanistan
Argentina
Australia
Austria
Bangladesh
Barbados
Belgium
Benin
Brazil
Burkina Faso
Cambodia
Cameroon
Central African Republic
Chile
China
Colombia
Costa Rica
Côte d'Ivoire
Croatia
Cuba
Cyprus
Czech Republic
Democratic Republic of the Congo
Denmark
Ecuador
Egypt
Ethiopia
Finland
France
Gabon
Germany
Ghana
Greece
Guatemala
Guinea
Haiti
Hong Kong
Hungary
Iceland
India
Indonesia
Iran
Ireland
Israel
Italy
Jamaica
Japan
Kenya
Kuwait
Lao People's Democratic Republic
Latvia
Lebanon
Lithuania
Luxembourg
Madagascar
Malawi
Malaysia
Mali
Mauritius
Mexico
Mongolia
Nepal
Netherlands
New Zealand
Niger
Nigeria
Norway
Pakistan
Peru
Philippines
Poland
Portugal
Puerto Rico
Romania
Russia
Rwanda
Saudi Arabia
Senegal
Singapore
Slovakia
South Africa
South Korea
Spain
Sri Lanka
Sudan
Sweden
Switzerland
Taiwan
Tanzania
Thailand
Turkey
Uganda
Ukraine
United Arab Emirates
United Kingdom
United States of America
Uruguay
Vietnam
Yugoslavia
Zambia
Zimbabwe
Figure 7: Leveraged Partner Funding by Sector (in millions of dollars) – Cumulative totals from 2000-01 to 2023-24
Due to rounding, figures may not reconcile with other published information
Includes partner contributions administered by CIHR, in kind and direct contributions from partner directly to the researcher
Includes both competition and applicant partner contributions where there may or may not be a formal agreement with CIHR
Figure 7 long description
Sector
Total
Percentage
Academia
$156
4.7%
Federal partners
$1,570
46.2%
International
$405
11.9%
Municipal/Provincial funder
$233
6.9%
Not-for-profit
$495
14.6%
Profit
$231
6.8%
Unspecified
$305
9.0%
Total
$3,397
100%
Figure 8: Leveraged Partner Funding by Sector (in millions of dollars) – 2023-24
Due to rounding, figures may not reconcile with other published information
Includes partner contributions administered by CIHR, in kind and direct contributions from partner directly to the researcher
Includes both competition and applicant partner contributions where there may or may not be a formal agreement with CIHR
Figure 8 long description
Sector
Total
Percentage
Academia
$2.5
3.7%
Federal partner
$24
35.5%
International
$17
25.1%
Municipal/Provincial funder
$1.6
2.3%
Not-for-profit
$16.3
24.1%
Profit
$0.2
0.4%
Unspecified
$6.1
9.0%
Total
$67.7
100%
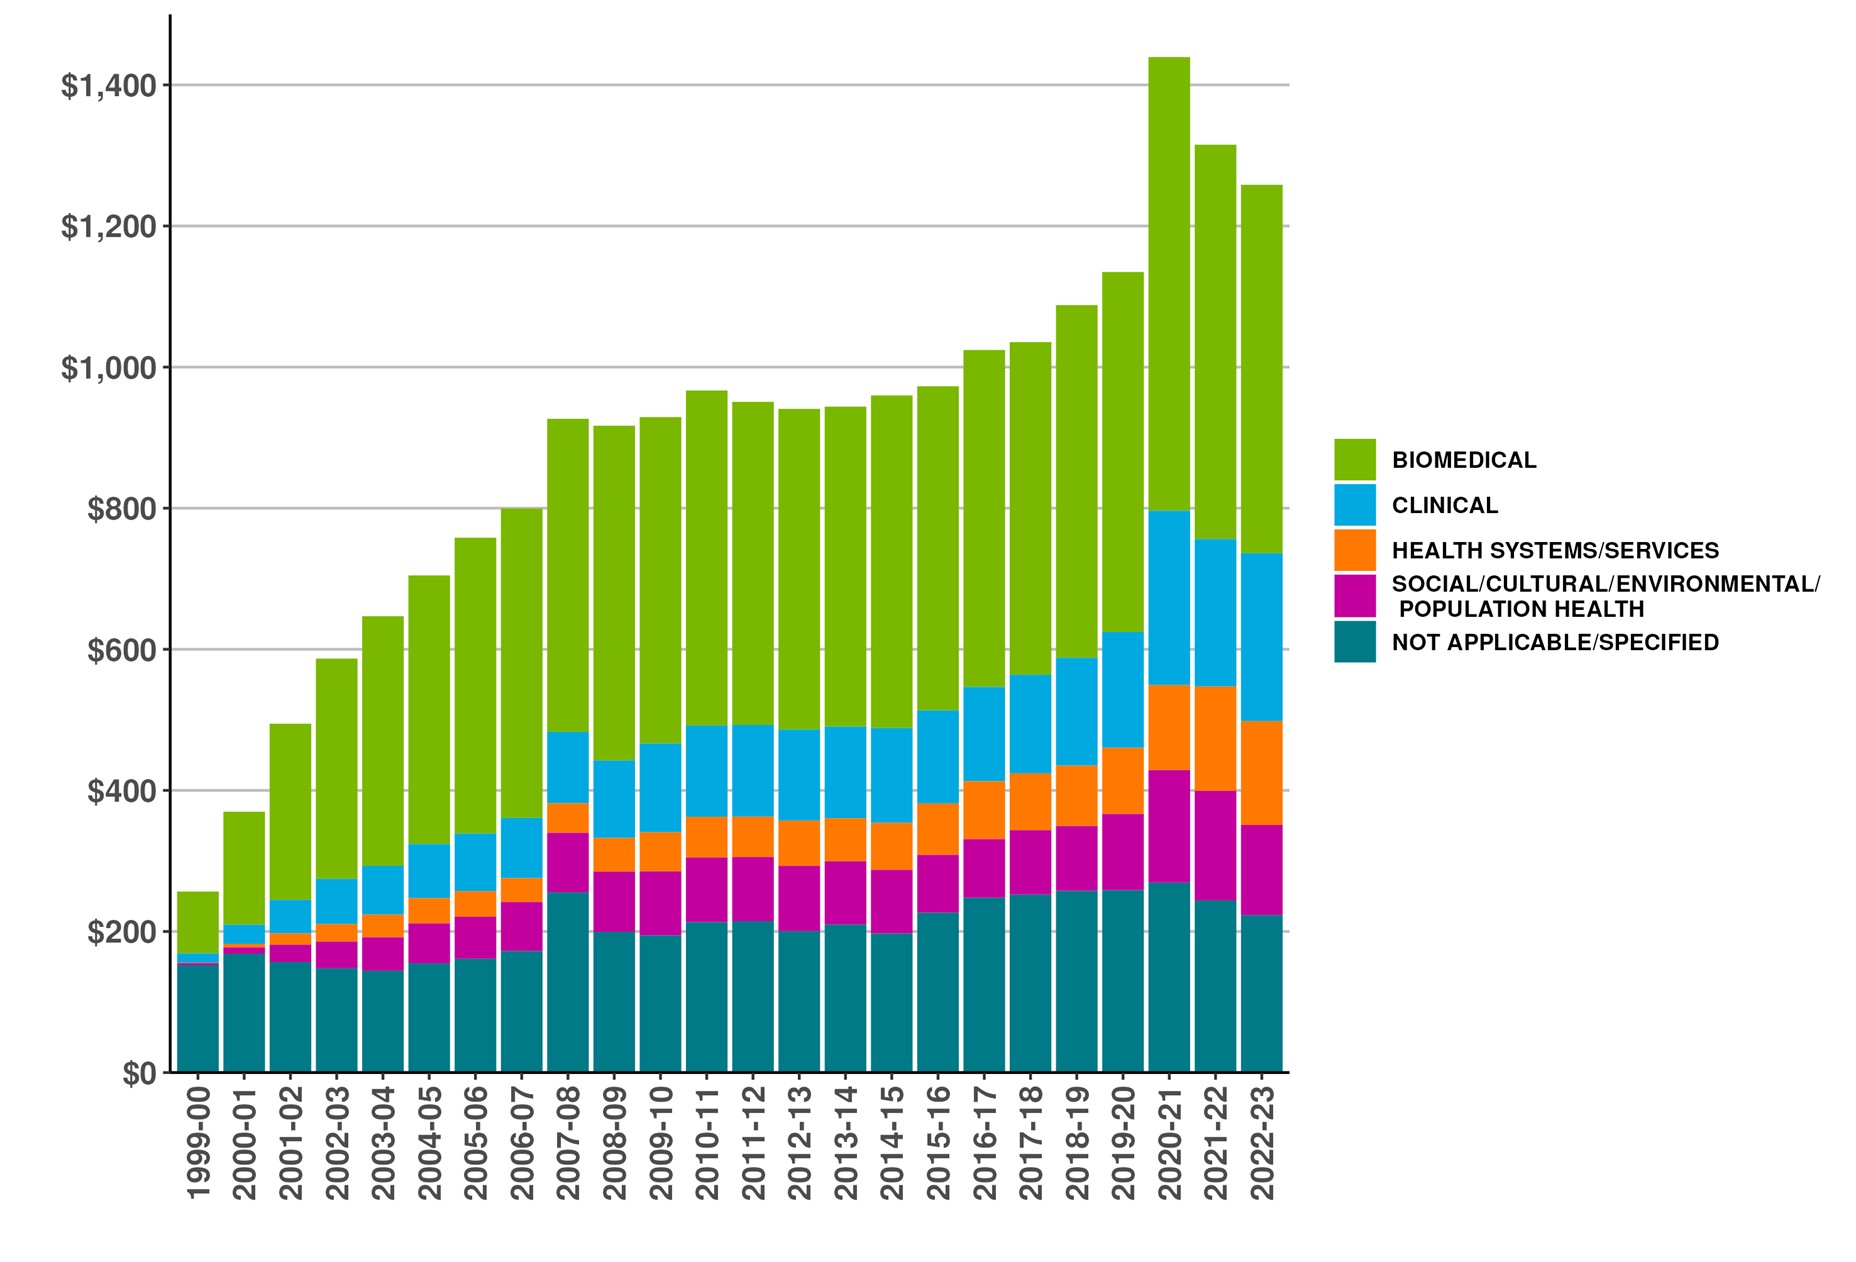
2022-2023
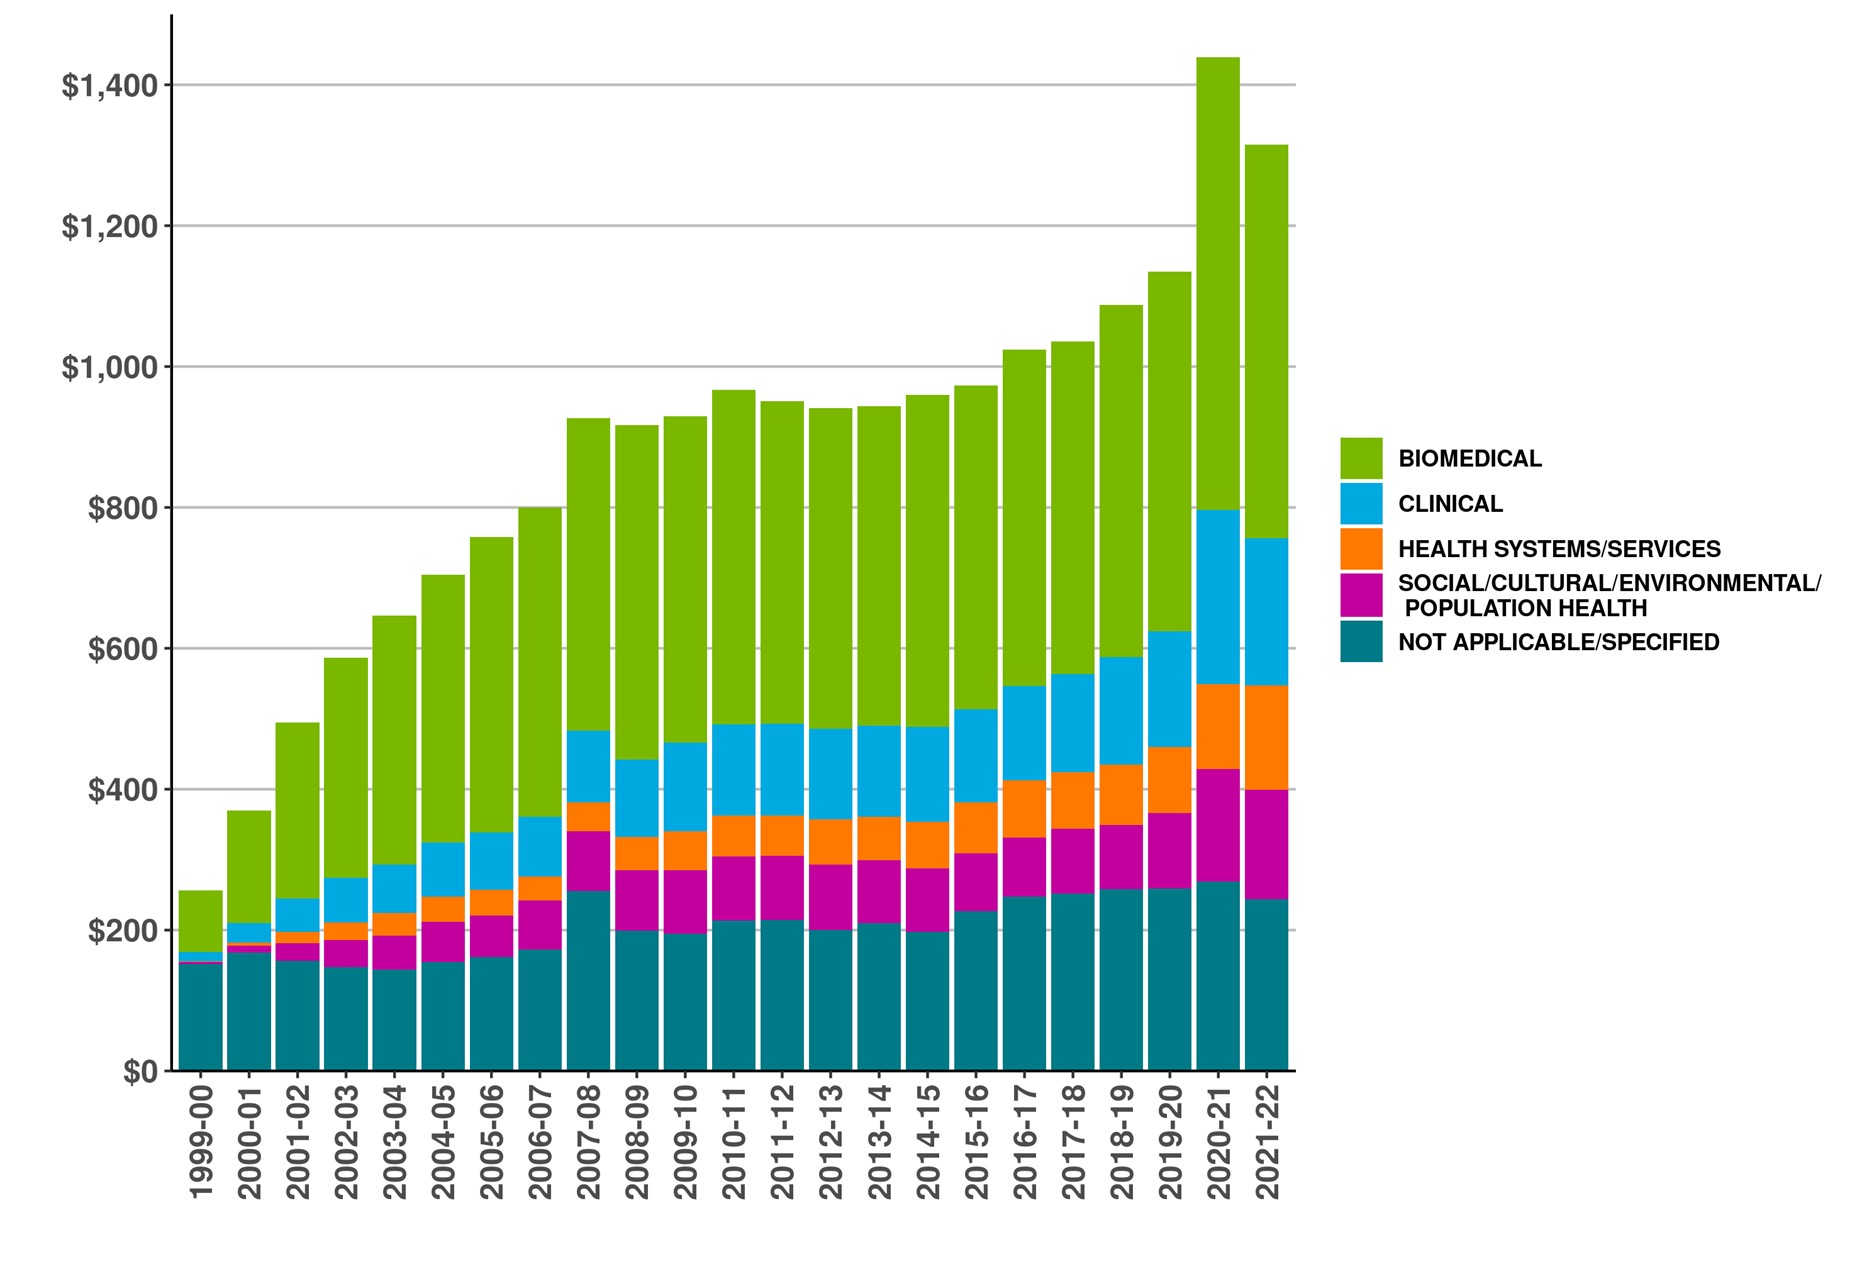
Figure 1: CIHR Fiscal Year Investments by Primary Theme since 1999-00 (in millions of dollars)
Due to rounding, figures may not reconcile with other published information
Excludes operating expenditures and partner contributions
Primary theme designation is determined by the grantee at the time of application
Figure 1 long description
Primary theme
1999-00
2000-01
2001-02
2002-03
2003-04
2004-05
2005-06
2006-07
2007-08
2008-09
2009-10
2010-11
2011-12
2012-13
2013-14
2014-15
2015-16
2016-17
2017-18
2018-19
2019-20
2020-21
2021-22
2022-23
Biomedical
$88
$160
$250
$312
$354
$381
$419
$439
$444
$474
$463
$475
$458
$455
$454
$471
$459
$478
$472
$500
$510
$643
$559
$522
Clinical
$13
$27
$47
$64
$69
$77
$82
$85
$101
$110
$126
$129
$130
$129
$130
$134
$132
$133
$140
$153
$164
$247
$209
$238
Health systems/services
$0.7
$5
$16
$25
$32
$36
$36
$34
$42
$48
$55
$58
$57
$64
$61
$66
$73
$82
$80
$86
$94
$120
$148
$147
Social/Cultural/Environmental/Population Health
$3
$9
$25
$38
$47
$56
$60
$69
$84
$85
$90
$91
$91
$92
$90
$90
$82
$83
$91
$92
$108
$160
$155
$128
Not applicable/Specified
$152
$168
$157
$148
$144
$155
$161
$172
$255
$199
$195
$213
$215
$201
$210
$197
$227
$248
$252
$258
$259
$269
$244
$223
Total
$257
$370
$494
$587
$647
$705
$758
$800
$927
$917
$929
$967
$951
$941
$944
$960
$973
$1,024
$1,035
$1,088
$1,135
$1,439
$1,315
$1,258
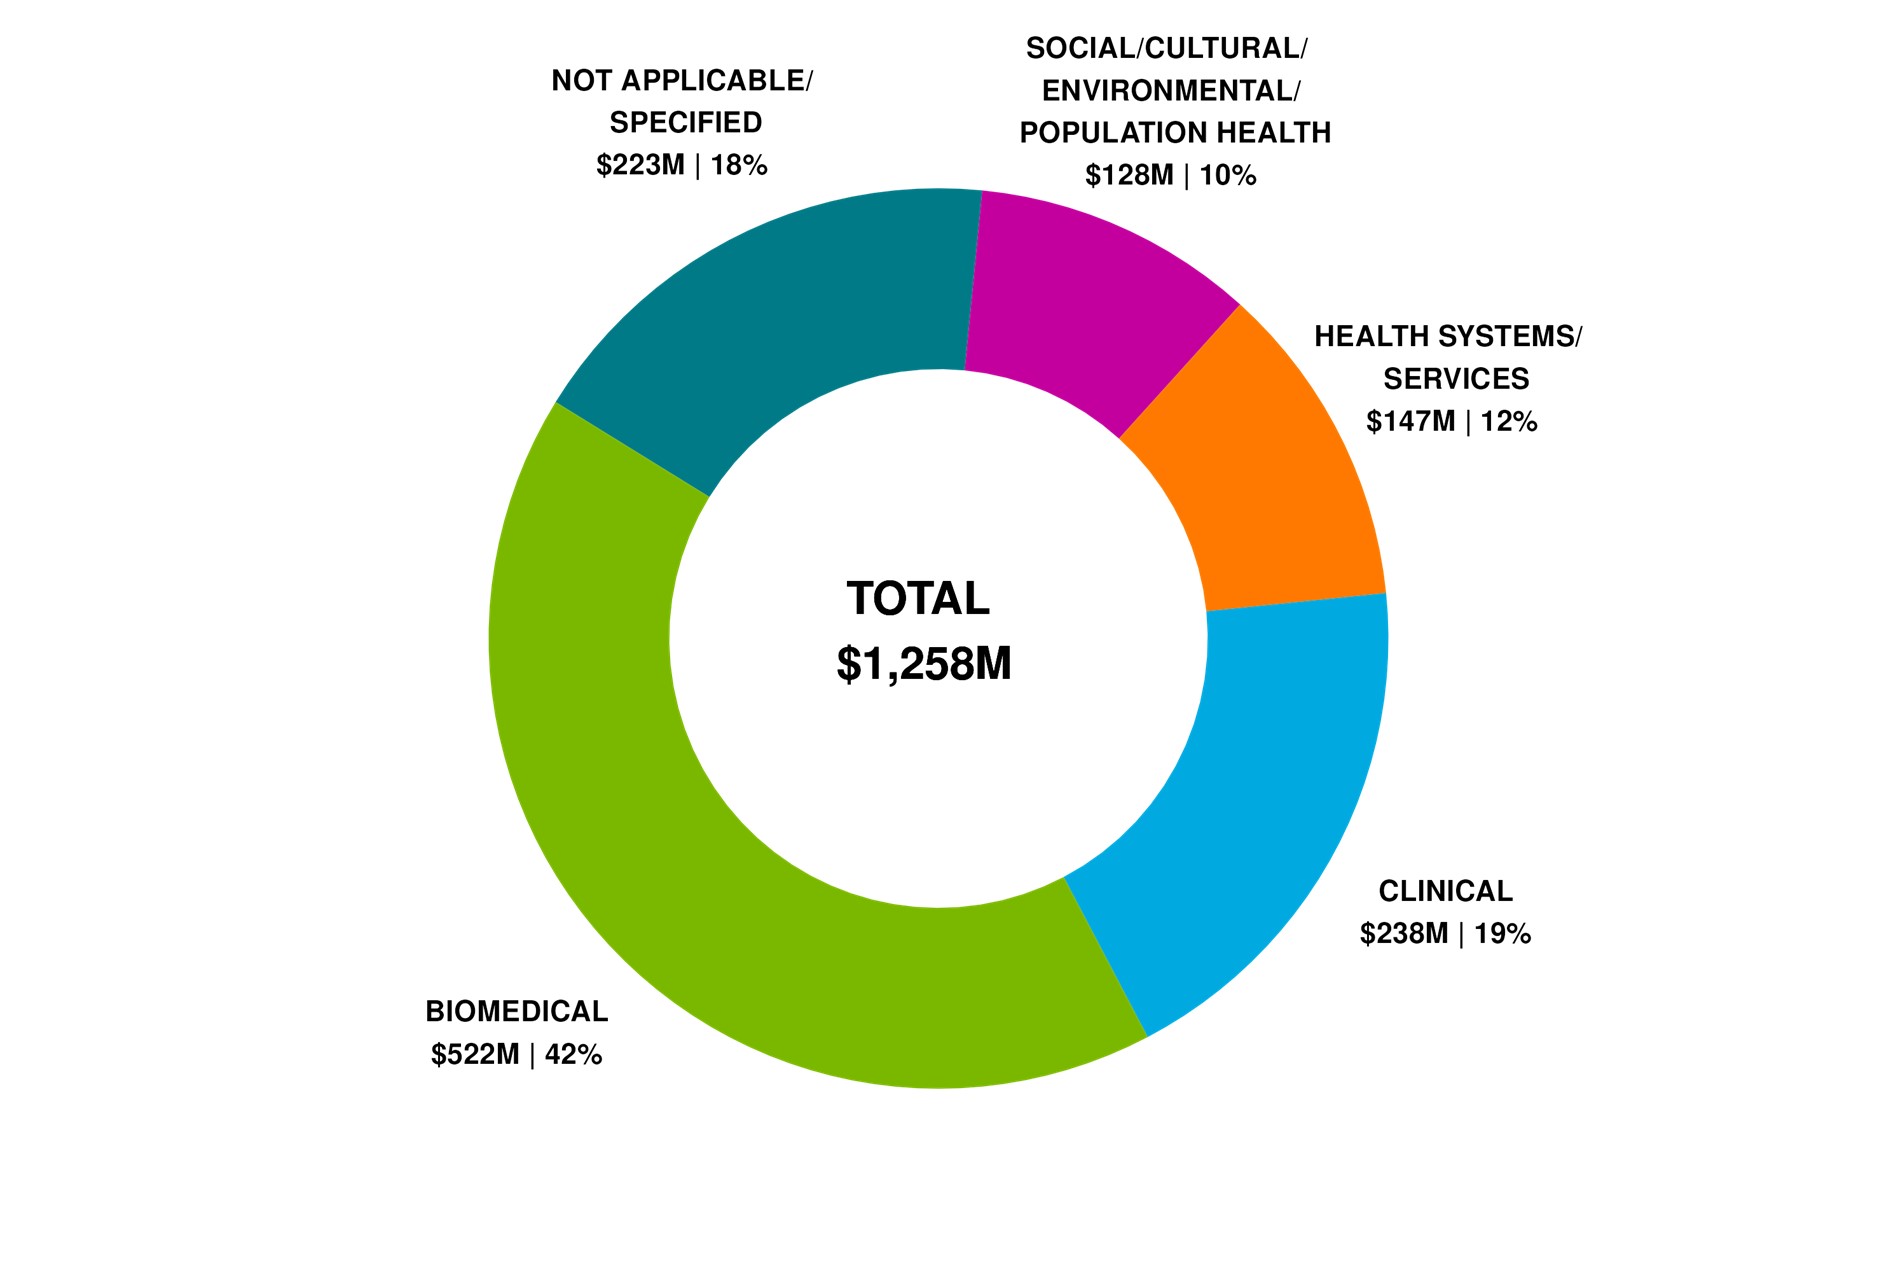
Figure 2: CIHR Investments by Primary Theme 2022-23 (in millions of dollars)
Due to rounding, figures may not reconcile with other published information
Excludes operating expenditures and partner contributions
Primary theme designation is determined by the grantee at the time of application
Figure 2 long description
Primary Theme
2022-23
Percentage Breakdown
Biomedical
$522
42%
Clinical
$238
19%
Health systems/services
$147
12%
Social/Cultural/Environmental/Population Health
$128
10%
Not applicable/Specified
$223
18%
Total
$1,258
100%
Figure 2: CIHR Investments by Primary Theme and COVID-19 funding 2022-23 (in millions of dollars)
Due to rounding, figures may not reconcile with other published information
Excludes operating expenditures and partner contributions
Primary theme designation is determined by the grantee at the time of application
COVID-19 funding is determined by granting to a COVID-19-specific funding competition
Figure 2 long description
Primary Theme
2022-23
Percentage Breakdown
Biomedical
non COVID-19
$521.9
41.47%
COVID-19
$0.4
0.03%
Clinical
non COVID-19
$221.4
17.59%
COVID-19
$16.6
1.32%
Health systems/services
non COVID-19
$143.2
11.38%
COVID-19
$4.0
0.32%
Social/Cultural/Environmental/Population Health
non COVID-19
$219.3
17.42%
COVID-19
$4.0
0.32%
Not applicable/Specified
non COVID-19
$126.2
10.03%
COVID-19
$1.5
0.12%
Total
$1,258
100%
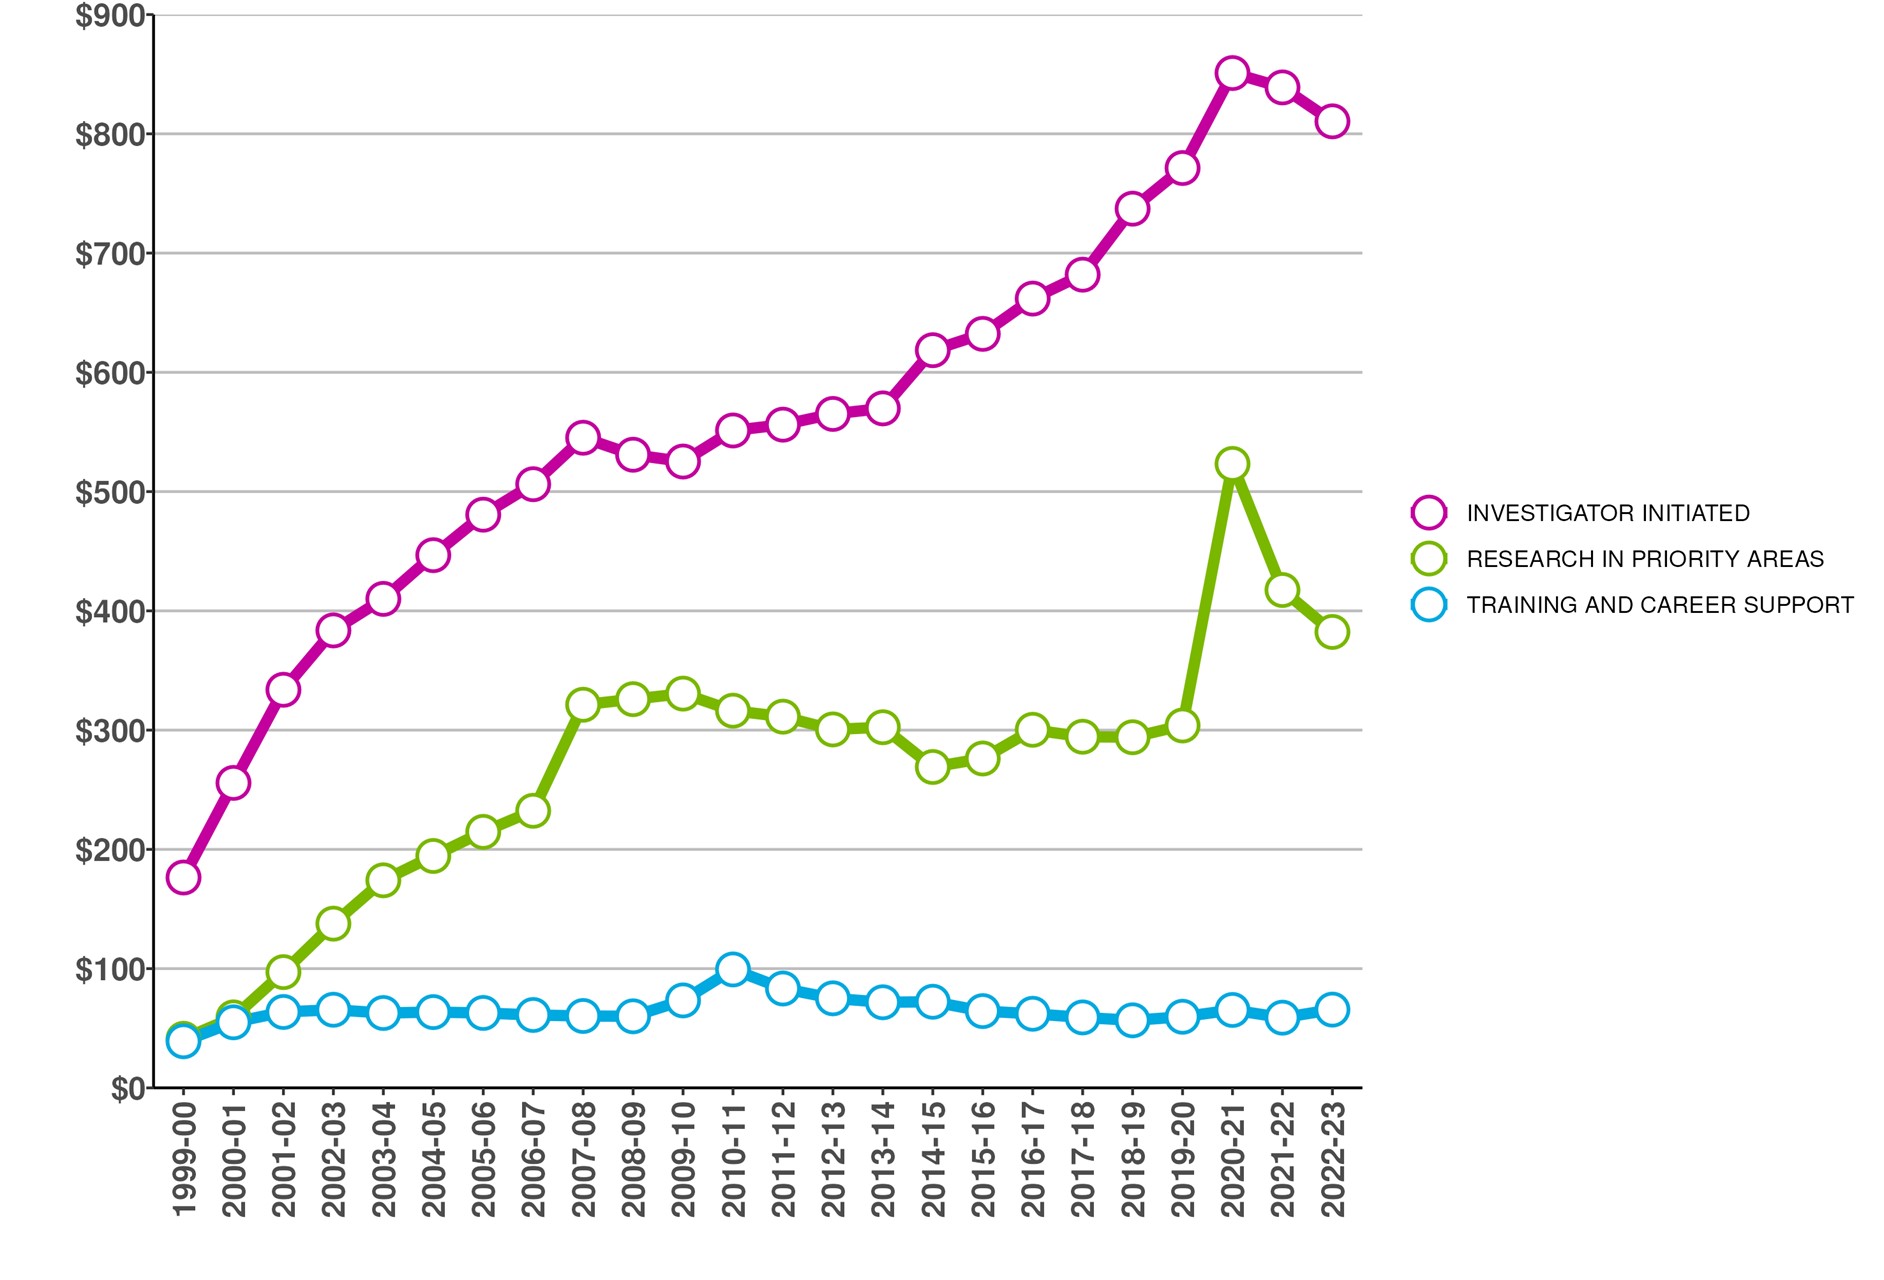
Figure 3: CIHR Fiscal Year Investments by Funding Type since 1999-00 (in millions of dollars)
Due to rounding, figures may not reconcile with other published information
Excludes operating expenditures and partner contributions
Figure 3 long description
Funding type
1999-00
2000-01
2001-02
2002-03
2003-04
2004-05
2005-06
2006-07
2007-08
2008-09
2009-10
2010-11
2011-12
2012-13
2013-14
2014-15
2015-16
2016-17
2017-18
2018-19
2019-20
2020-21
2021-22
2022-23
Investigator Initiated
$176
$256
$334
$384
$410
$447
$481
$506
$545
$531
$525
$551
$556
$565
$570
$619
$632
$662
$682
$737
$771
$851
$839
$810
Research in Priority Areas
$41
$59
$97
$138
$174
$194
$215
$232
$321
$326
$331
$316
$311
$301
$302
$269
$276
$300
$294
$294
$304
$523
$417
$382
Training and Career Support
$39
$55
$64
$65
$63
$63
$63
$61
$60
$60
$73
$99
$83
$75
$72
$72
$64
$62
$59
$57
$60
$65
$59
$66
Total
$257
$370
$494
$587
$647
$705
$758
$800
$927
$917
$929
$967
$951
$941
$944
$960
$973
$1,024
$1,035
$1,088
$1,135
$1,439
$1,315
$1,258
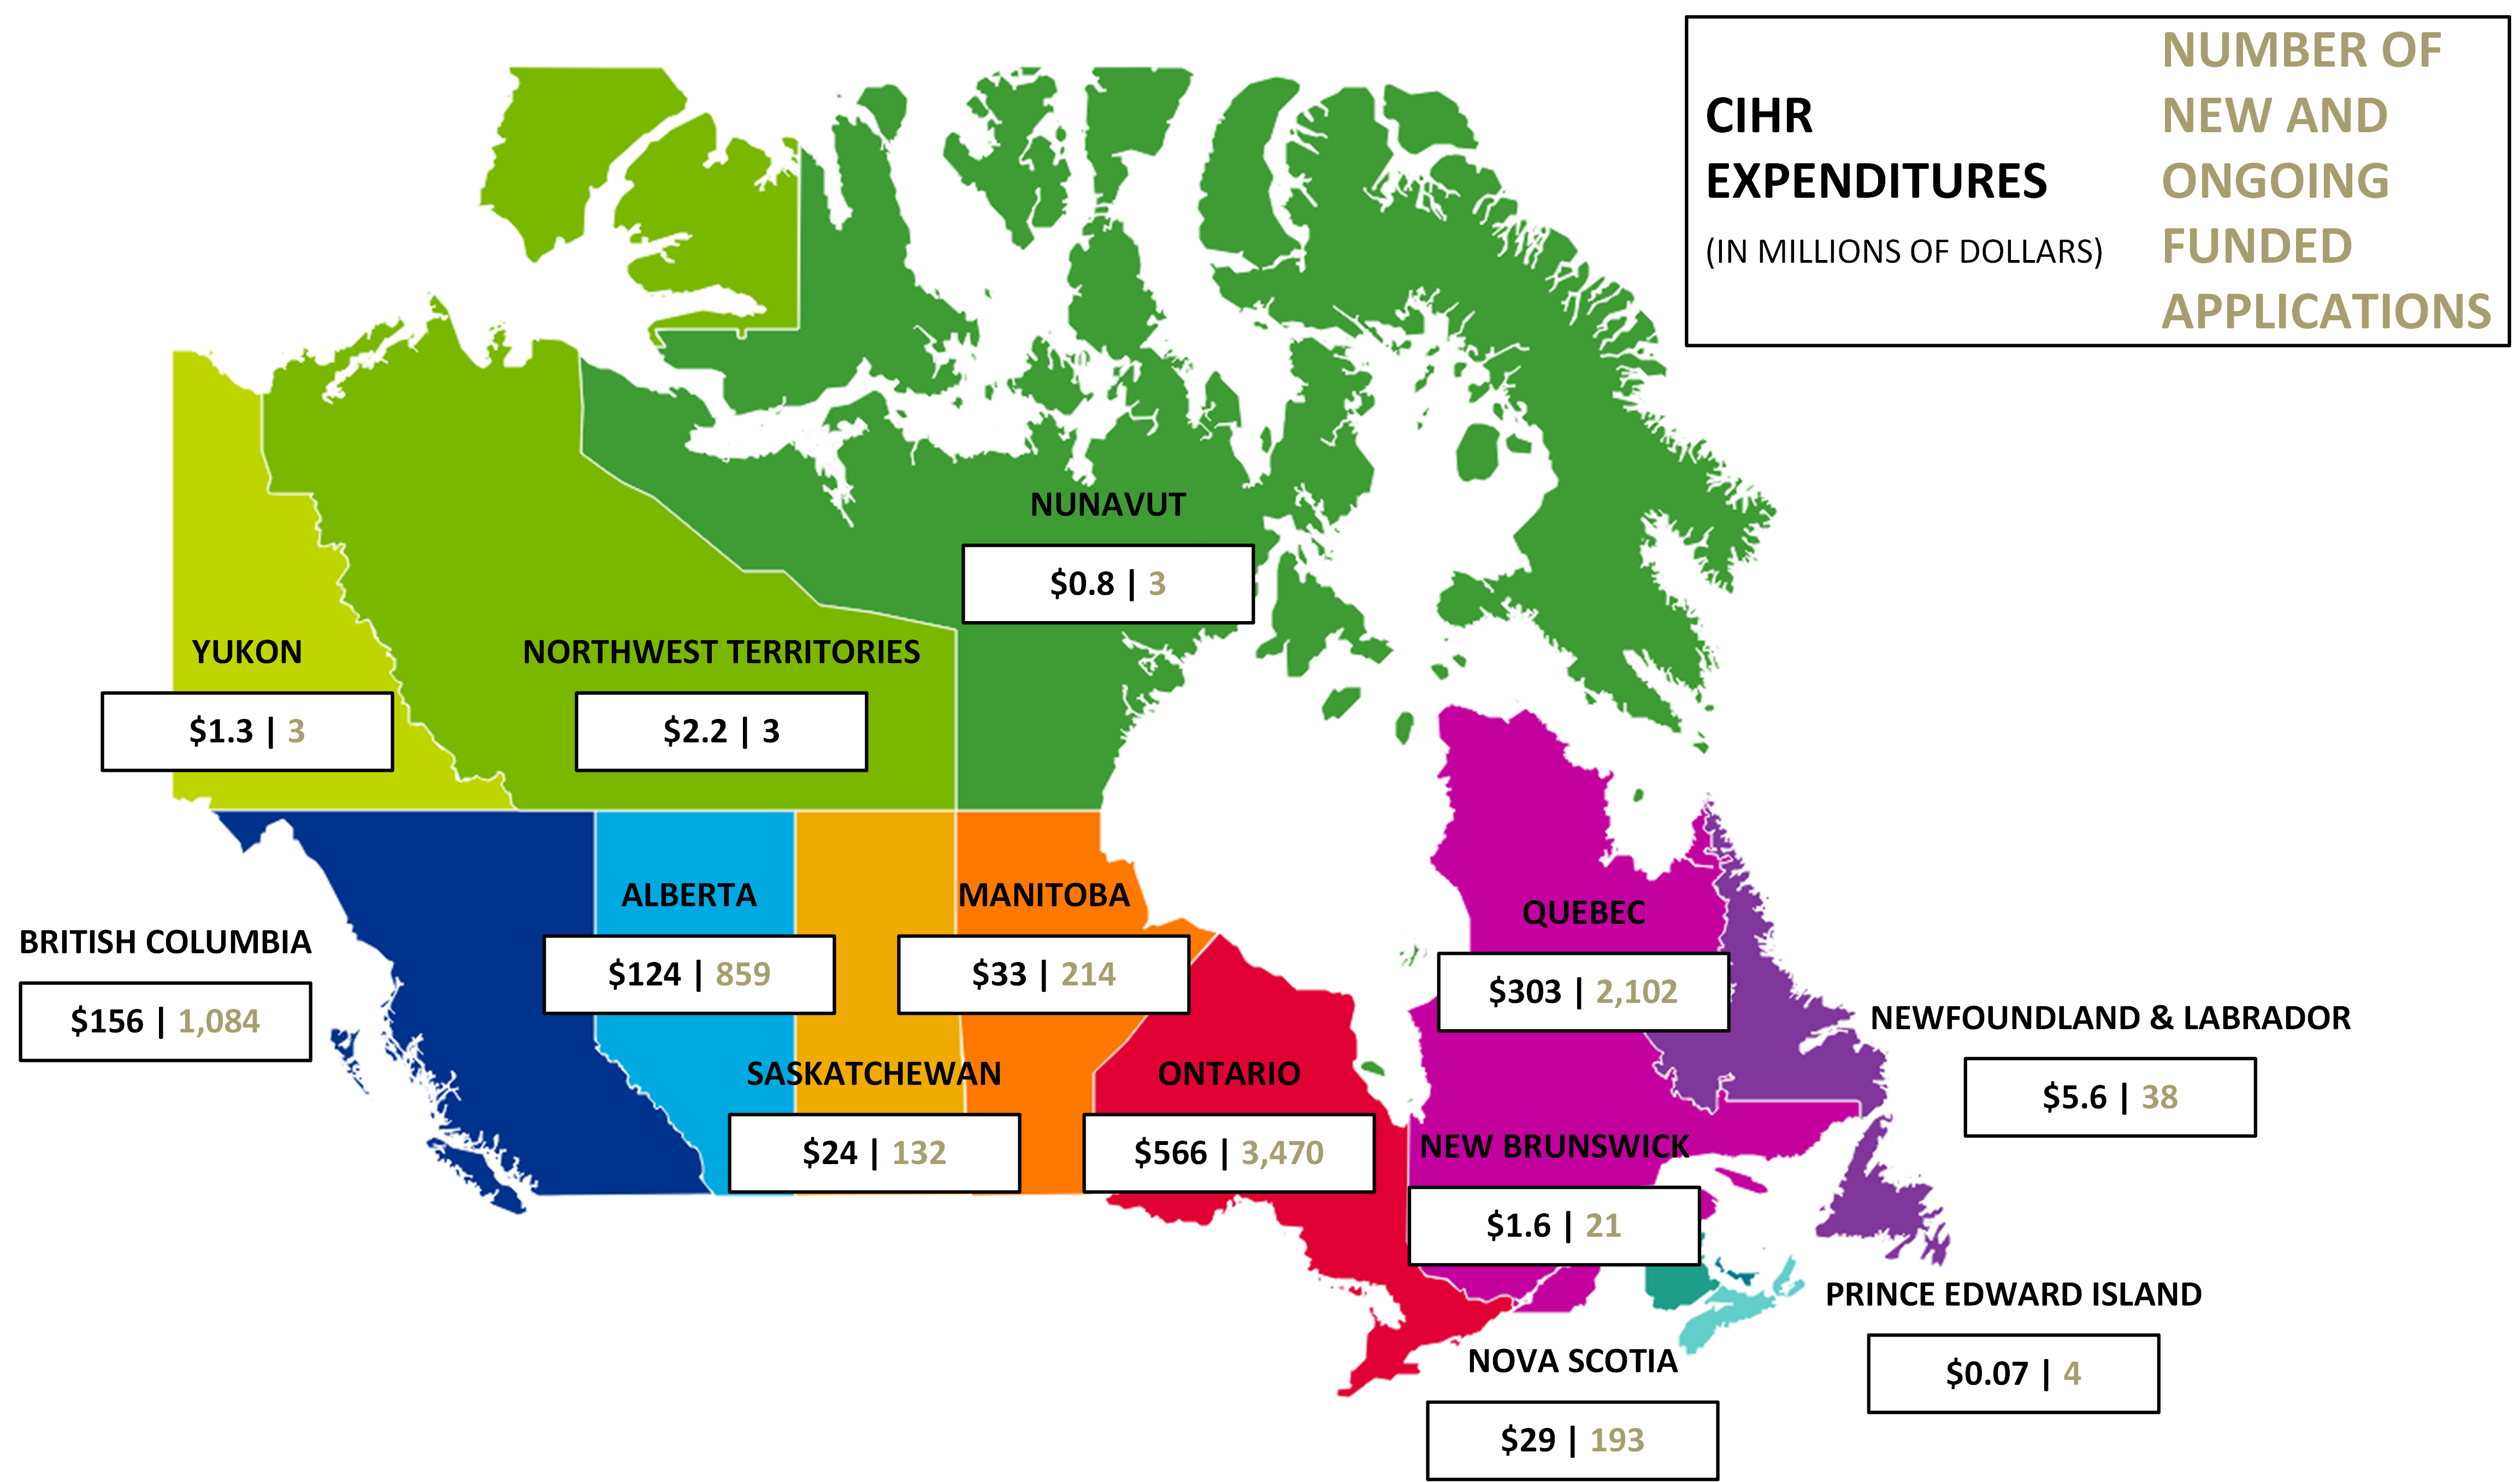
Figure 4: CIHR Investments by Region in 2022-23 (in millions of dollars)
Due to rounding, figures may not reconcile with other published information
Excludes operating expenditures, partner contributions and direct payments
Figure 4 long description
Region
CIHR Expenditures 2022-23
Number of new and ongoing funded applications 2022-23
Alberta
$124
859
British Columbia
$156
1,084
Manitoba
$33
214
New Brunswick
$1.6
21
Newfoundland & Labrador
$5.6
38
North West Territories
$2.2
3
Nova Scotia
$29
193
Nunavut
$0.8
3
Ontario
$566
3,470
Prince Edward Island
$0.07
4
Quebec
$303
2,102
Saskatchewan
$24
132
Yukon
$1.3
3
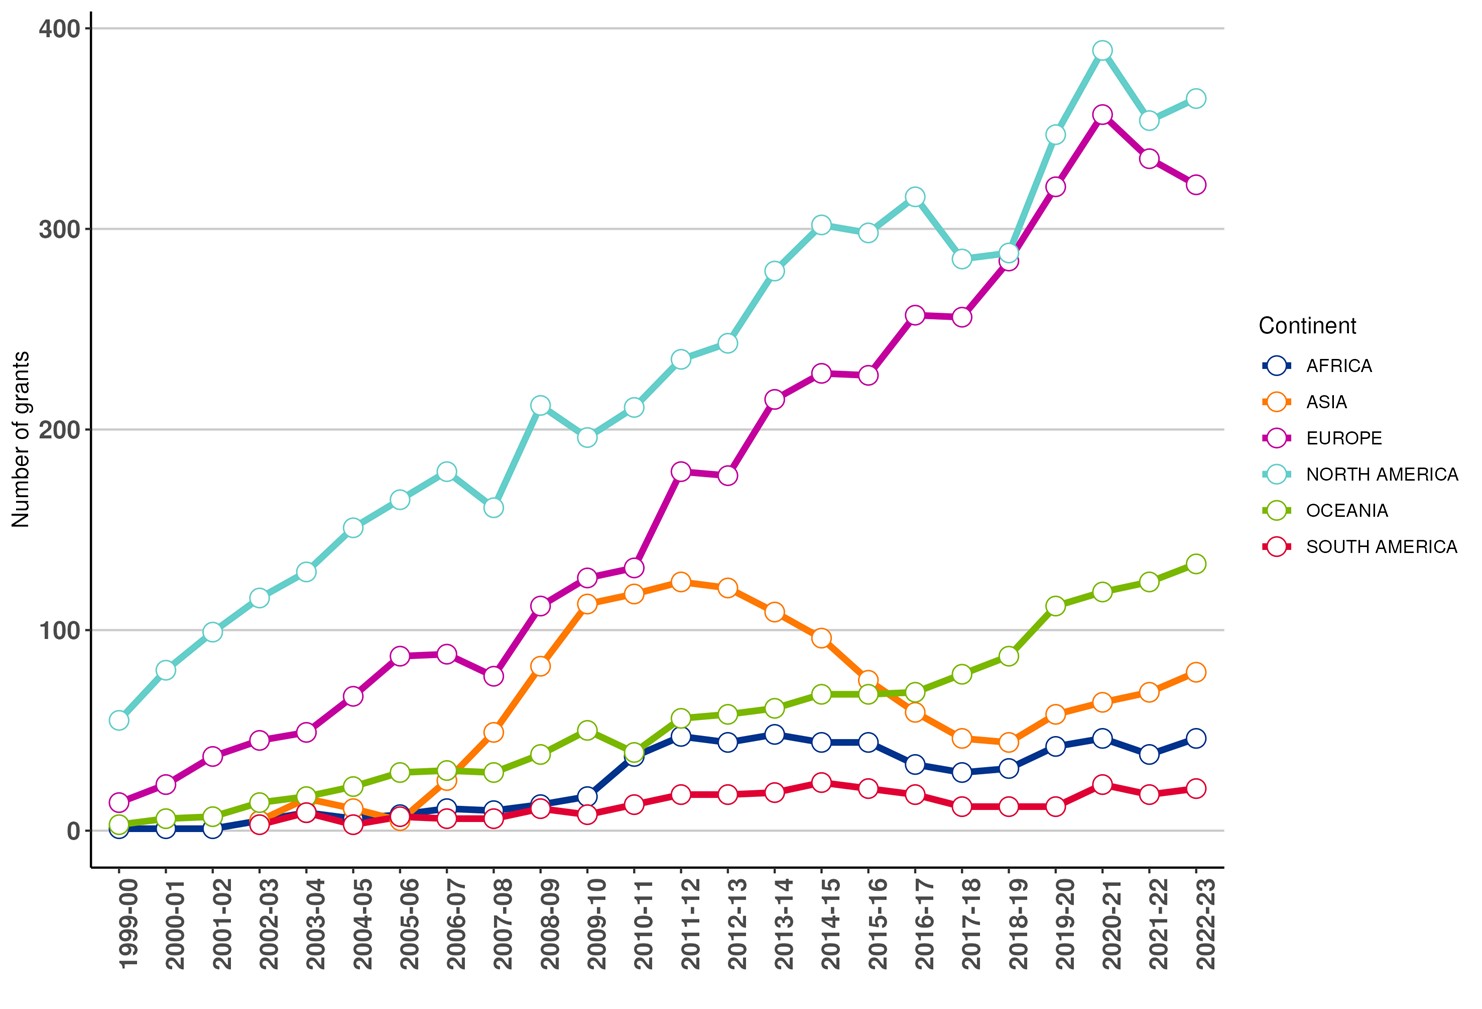
Figure 5a: Number of New and Ongoing Projects
Due to rounding as well as changes in methodology, figures may not reconcile with other published information.
Excludes operating expenditures and partner contributions.
As of March 2021, an updated method is used to determine international collaborators based on affiliations at the time of grant submission.
Figure 5a long description
Continent
1999-00
2000-01
2001-02
2002-03
2003-04
2004-05
2005-06
2006-07
2007-08
2008-09
2009-10
2010-11
2011-12
2012-13
2013-14
2014-15
2015-16
2016-17
2017-18
2018-19
2019-20
2020-21
2021-22
2022-23
Africa
1
1
1
5
9
6
8
11
10
13
17
37
47
44
48
44
44
33
29
31
42
46
38
46
Europe
14
23
37
45
49
67
87
88
77
112
126
131
179
177
215
228
227
257
256
284
321
357
334
322
North America
55
80
99
116
129
151
165
179
161
212
196
211
235
243
279
302
298
316
284
287
344
387
350
365
Oceania
3
6
7
14
17
22
29
30
29
38
50
39
56
58
61
68
68
69
78
87
112
119
124
133
Asia
0
0
0
5
16
11
5
25
49
82
113
118
124
121
109
96
75
59
46
44
58
64
69
79
South America
0
0
0
3
9
3
7
6
6
11
8
13
18
18
19
24
21
18
12
12
12
23
16
21
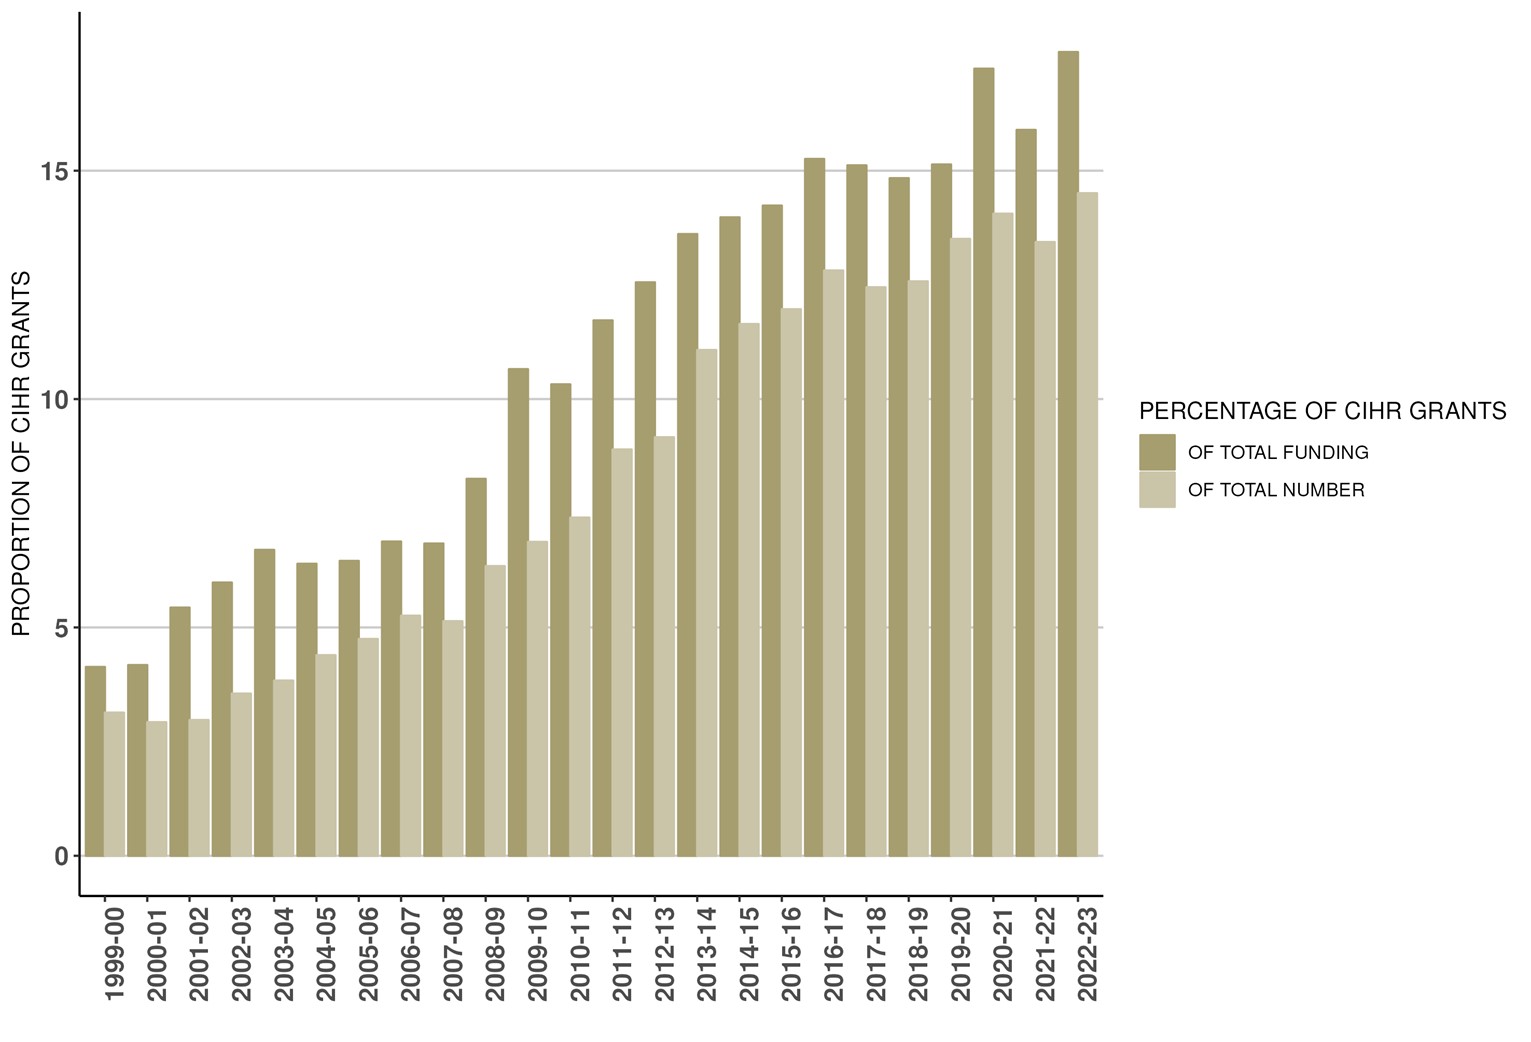
Figure 5b: Proportion of CIHR Grants with International linkages since 1999-00
Due to rounding as well as changes in methodology, figures may not reconcile with other published information.
Excludes operating expenditures and partner contributions.
As of March 2021, an updated method is used to determine international collaborators based on affiliations at the time of grant submission.
Figure 5b long description
Proportion
1999-00
2000-01
2001-02
2002-03
2003-04
2004-05
2005-06
2006-07
2007-08
2008-09
2009-10
2010-11
2011-12
2012-13
2013-14
2014-15
2015-16
2016-17
2017-18
2018-19
2019-20
2020-21
2021-22
2022-23
Percentage of total CIHR investments
4.1%
4.2%
5.4%
6%
6.7%
6.4%
6.5%
6.9%
6.8%
8.3%
10.7%
10.3%
11.7%
12.6%
13.6%
14%
14.2%
15.2%
15.1%
14.7%
15%
17.1%
15.7%
17.6%
Percentage of total # of CIHR grants
3.1%
2.9%
3%
3.6%
3.8%
4.4%
4.7%
5.3%
5.1%
6.3%
6.9%
7.4%
8.9%
9.2%
11.1%
11.6%
12%
12.8%
12.4%
12.6%
13.5%
14%
13.4%
14.5%
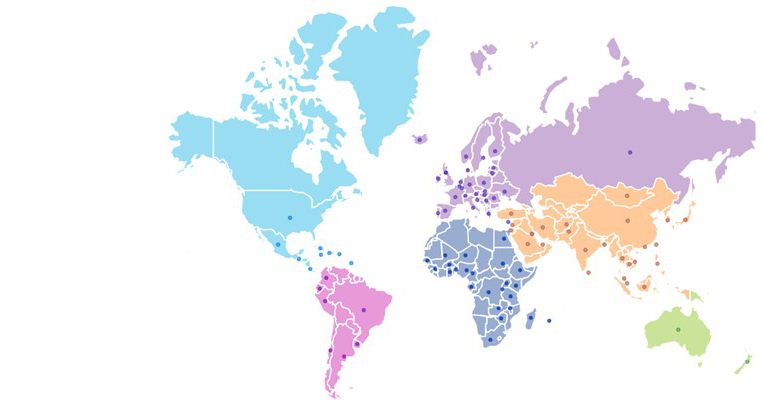
Figure 6: Countries with an International Linkage to a CIHR grants since 1999-00
Due to changes in methodology, figures may not reconcile with other published information
Figure 6 long description
Countries
Afghanistan
Argentina
Australia
Austria
Bangladesh
Barbados
Belgium
Benin
Brazil
Burkina Faso
Cambodia
Cameroon
Central African Republic
Chile
China
Colombia
Costa Rica
Côte d'Ivoire
Croatia
Cuba
Cyprus
Czech Republic
Democratic Republic of the Congo
Denmark
Ecuador
Egypt
England
Ethiopia
Finland
France
Gabon
Germany
Ghana
Greece
Guatemala
Guinea
Haiti
Hong Kong
Hungary
Iceland
India
Indonesia
Iran
Ireland
Israel
Italy
Jamaica
Japan
Kenya
Kuwait
Lao People's Democratic Republic
Latvia
Lebanon
Lithuania
Luxembourg
Madagascar
Malaysia
Mali
Mauritius
Mexico
Mongolia
Nepal
Netherlands
New Zealand
Niger
Nigeria
Norway
Pakistan
Peru
Philippines
Poland
Portugal
Puerto Rico
Romania
Russia
Rwanda
Saudi Arabia
Scotland
Senegal
Singapore
Slovakia
South Africa
South Korea
Spain
Sri Lanka
Sudan
Sweden
Switzerland
Taiwan
Tanzania
Thailand
Turkey
Uganda
Ukraine
United Arab Emirates
United Kingdom
United States
Uruguay
Vietnam
Yugoslavia
Zambia
Zimbabwe
Figure 7: Leveraged Partner Funding by Sector (in millions of dollars) – Cumulative totals from 1999-00 to 2022-23
Due to rounding, figures may not reconcile with other published information
Includes partner contributions administered by CIHR, in kind and direct contributions from partner directly to the researcher
Includes both competition and applicant partner contributions where there may or may not be a formal agreement with CIHR
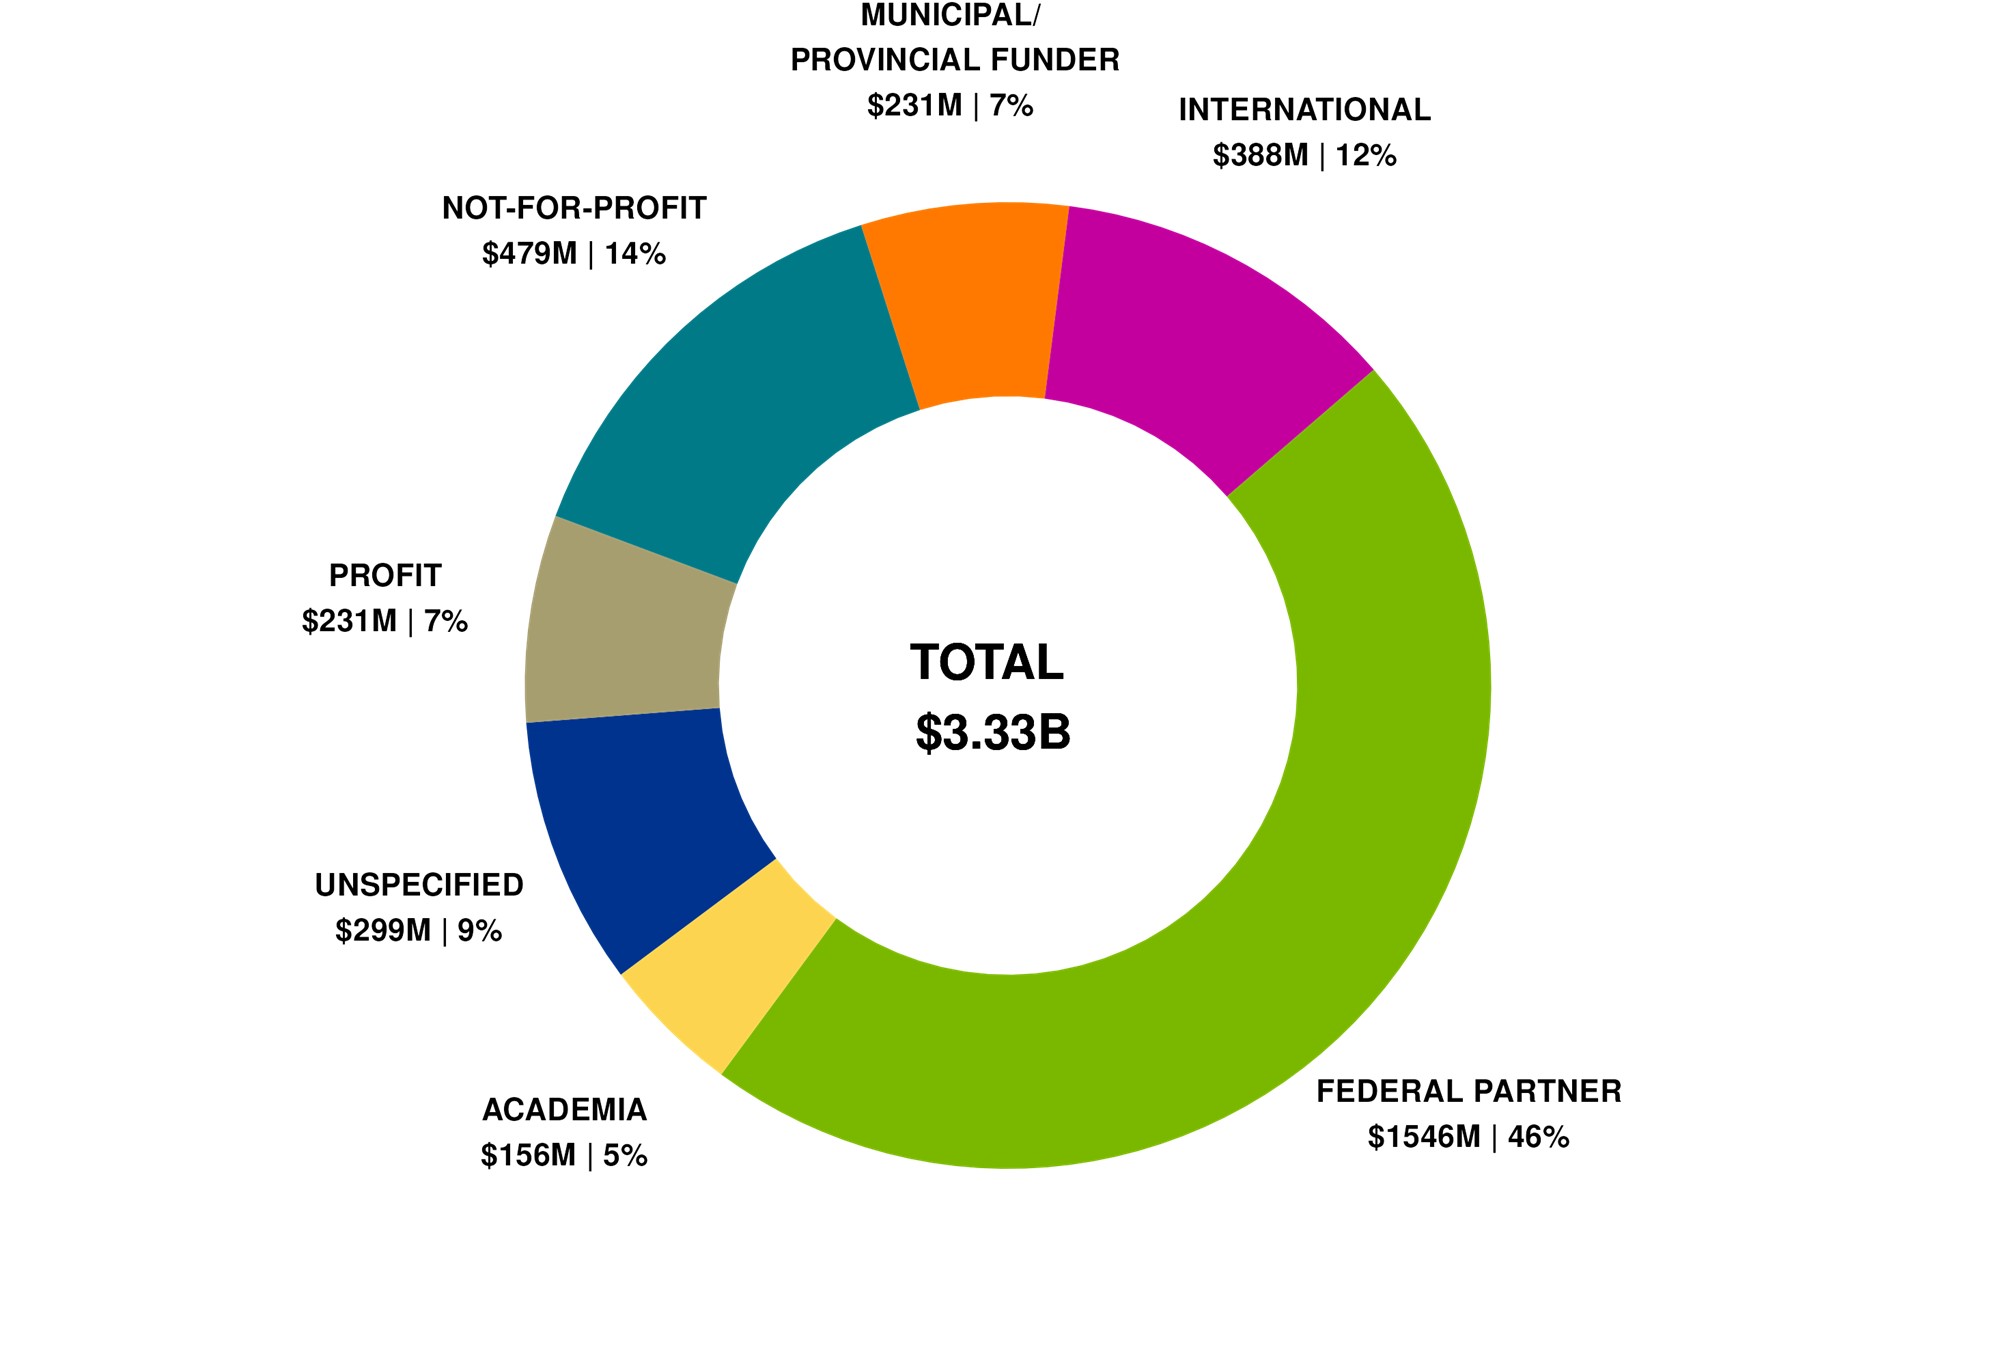
Figure 7 long description
Sector
Total
Percentage
Academia
$156
4.7%
Federal partners
$1,546
46.4%
International
$388
11.6%
Municipal/Provincial funder
$231
6.9%
Not-for-profit
$479
14.4%
Profit
$231
6.9%
Unspecified
$299
9.0%
Total
$3,329
100%
Figure 8: Leveraged Partner Funding by Sector (in millions of dollars) – 2022-23
Due to rounding, figures may not reconcile with other published information
Includes partner contributions administered by CIHR, in kind and direct contributions from partner directly to the researcher
Includes both competition and applicant partner contributions where there may or may not be a formal agreement with CIHR
Figure 8 long description
Sector
Total
Percentage
Academia
$2
1.3%
Federal partner
$91
66.5%
International
$23
16.4%
Municipal/Provincial funder
$3
2.4%
Not-for-profit
$13
9.5%
Profit
$1
0.4%
Unspecified
$5
3.4%
Total
$138
100%
2021-2022
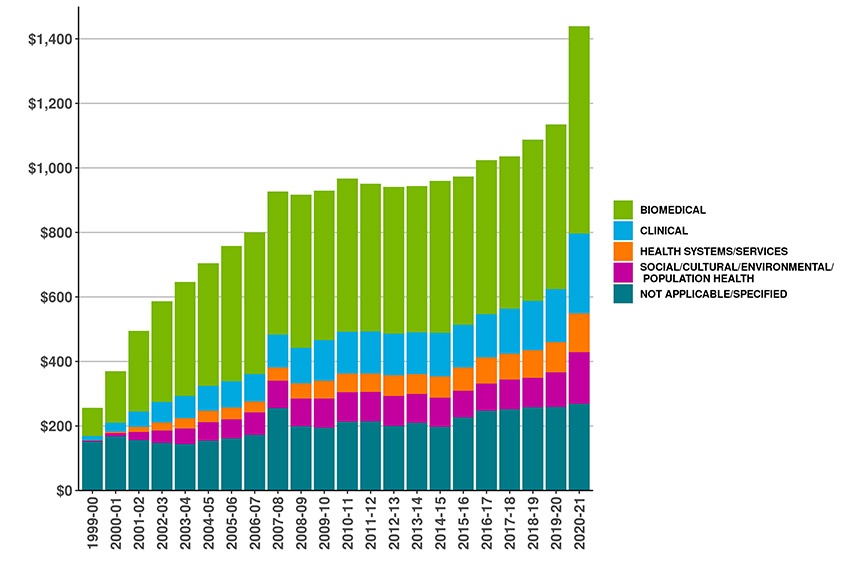
Figure 1: CIHR Fiscal Year Investments by Primary Theme since 1999-00 (in millions of dollars)
Due to rounding, figures may not reconcile with other published information
Excludes operating expenditures and partner contributions
Primary theme designation is determined by the grantee at the time of application
Figure 1 long description
Primary theme
1999-00
2000-01
2001-02
2002-03
2003-04
2004-05
2005-06
2006-07
2007-08
2008-09
2009-10
2010-11
2011-12
2012-13
2013-14
2014-15
2015-16
2016-17
2017-18
2018-19
2019-20
2020-21
2021-22
Biomedical
$88
$160
$250
$312
$354
$381
$419
$439
$444
$474
$463
$475
$458
$455
$454
$471
$459
$478
$472
$500
$510
$643
$559
Clinical
$13
$27
$47
$64
$69
$77
$82
$85
$101
$110
$126
$129
$130
$129
$130
$134
$132
$133
$140
$153
$164
$247
$209
Health systems/services
$0.7
$5
$16
$25
$32
$36
$36
$34
$42
$48
$55
$58
$57
$64
$61
$66
$73
$82
$80
$86
$94
$120
$148
Social/Cultural/Environmental/Population Health
$3
$9
$25
$38
$47
$56
$60
$69
$84
$85
$90
$91
$91
$92
$90
$90
$82
$83
$91
$92
$108
$160
$155
Not applicable/Specified
$152
$168
$157
$148
$144
$155
$161
$172
$255
$199
$195
$213
$215
$201
$210
$197
$227
$248
$252
$258
$259
$269
$244
Total
$257
$370
$494
$587
$647
$705
$758
$800
$927
$917
$929
$967
$951
$941
$944
$960
$973
$1,024
$1,035
$1,088
$1,135
$1,439
$1,315
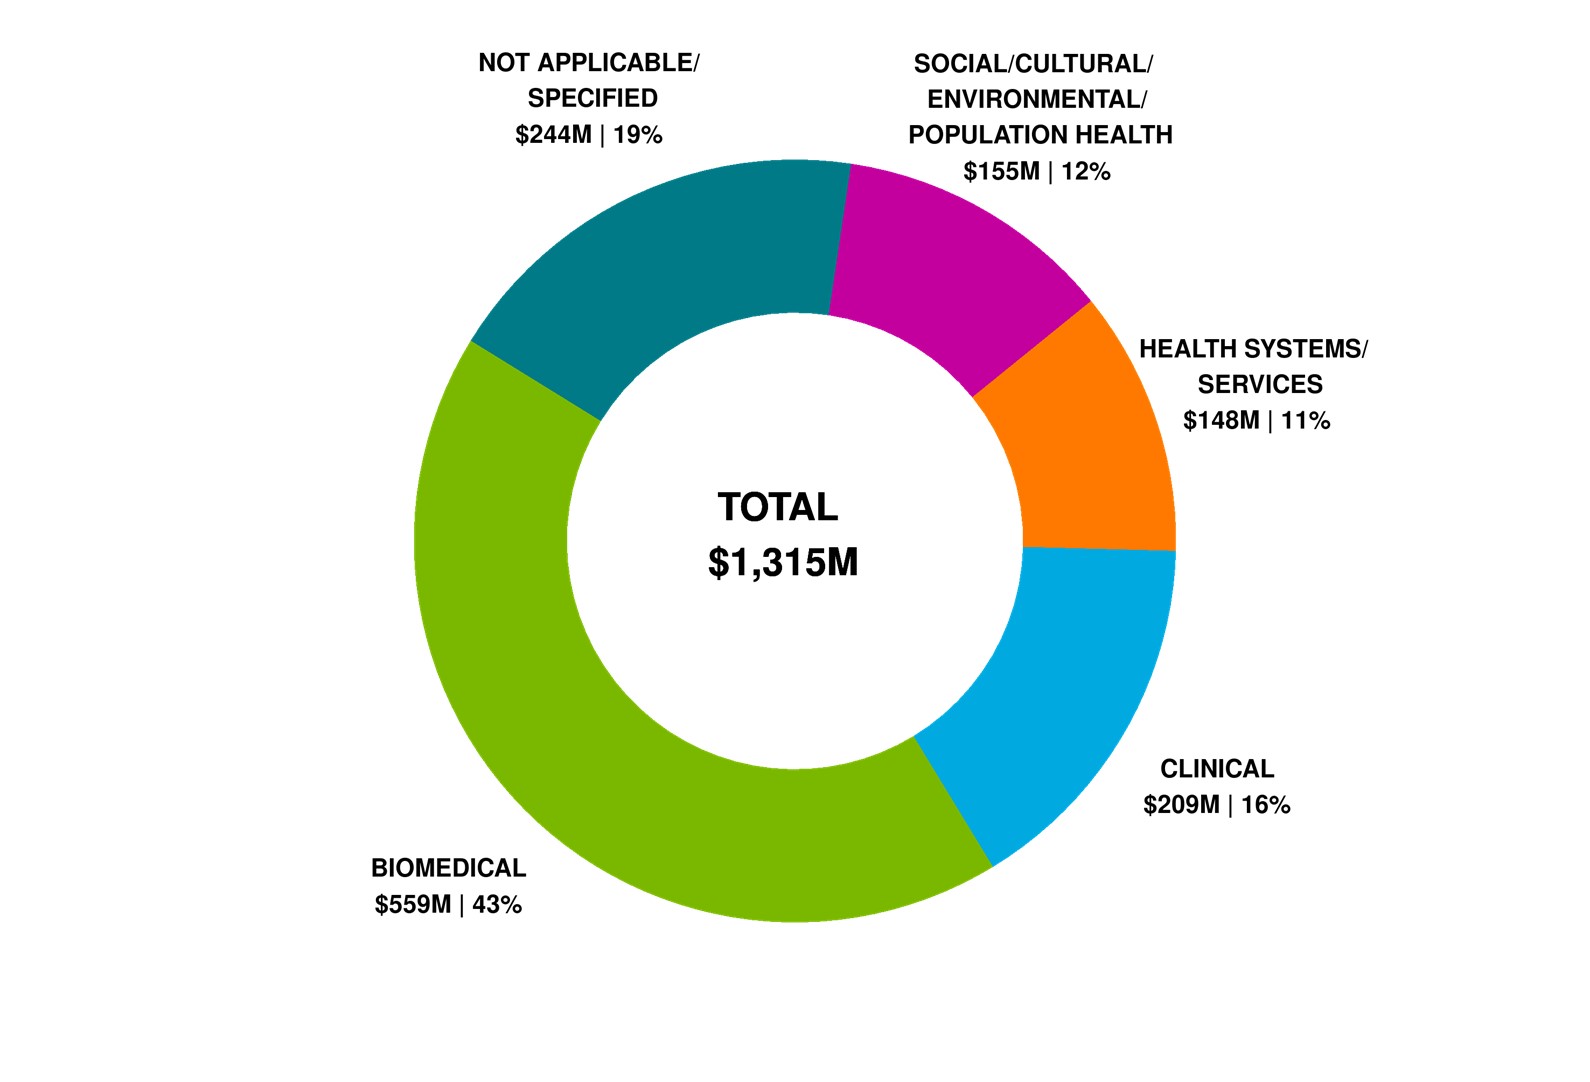
Figure 2: CIHR Investments by Primary Theme 2021-22 (in millions of dollars)
Due to rounding, figures may not reconcile with other published information
Excludes operating expenditures and partner contributions
Primary theme designation is determined by the grantee at the time of application
Figure 2 long description
Primary Theme
2021-22
Percentage Breakdown
Biomedical
$559
43%
Clinical
$209
16%
Health systems/services
$148
11%
Social/Cultural/Environmental/Population Health
$155
12%
Not applicable/Specified
$244
19%
Total
$1,315
100%
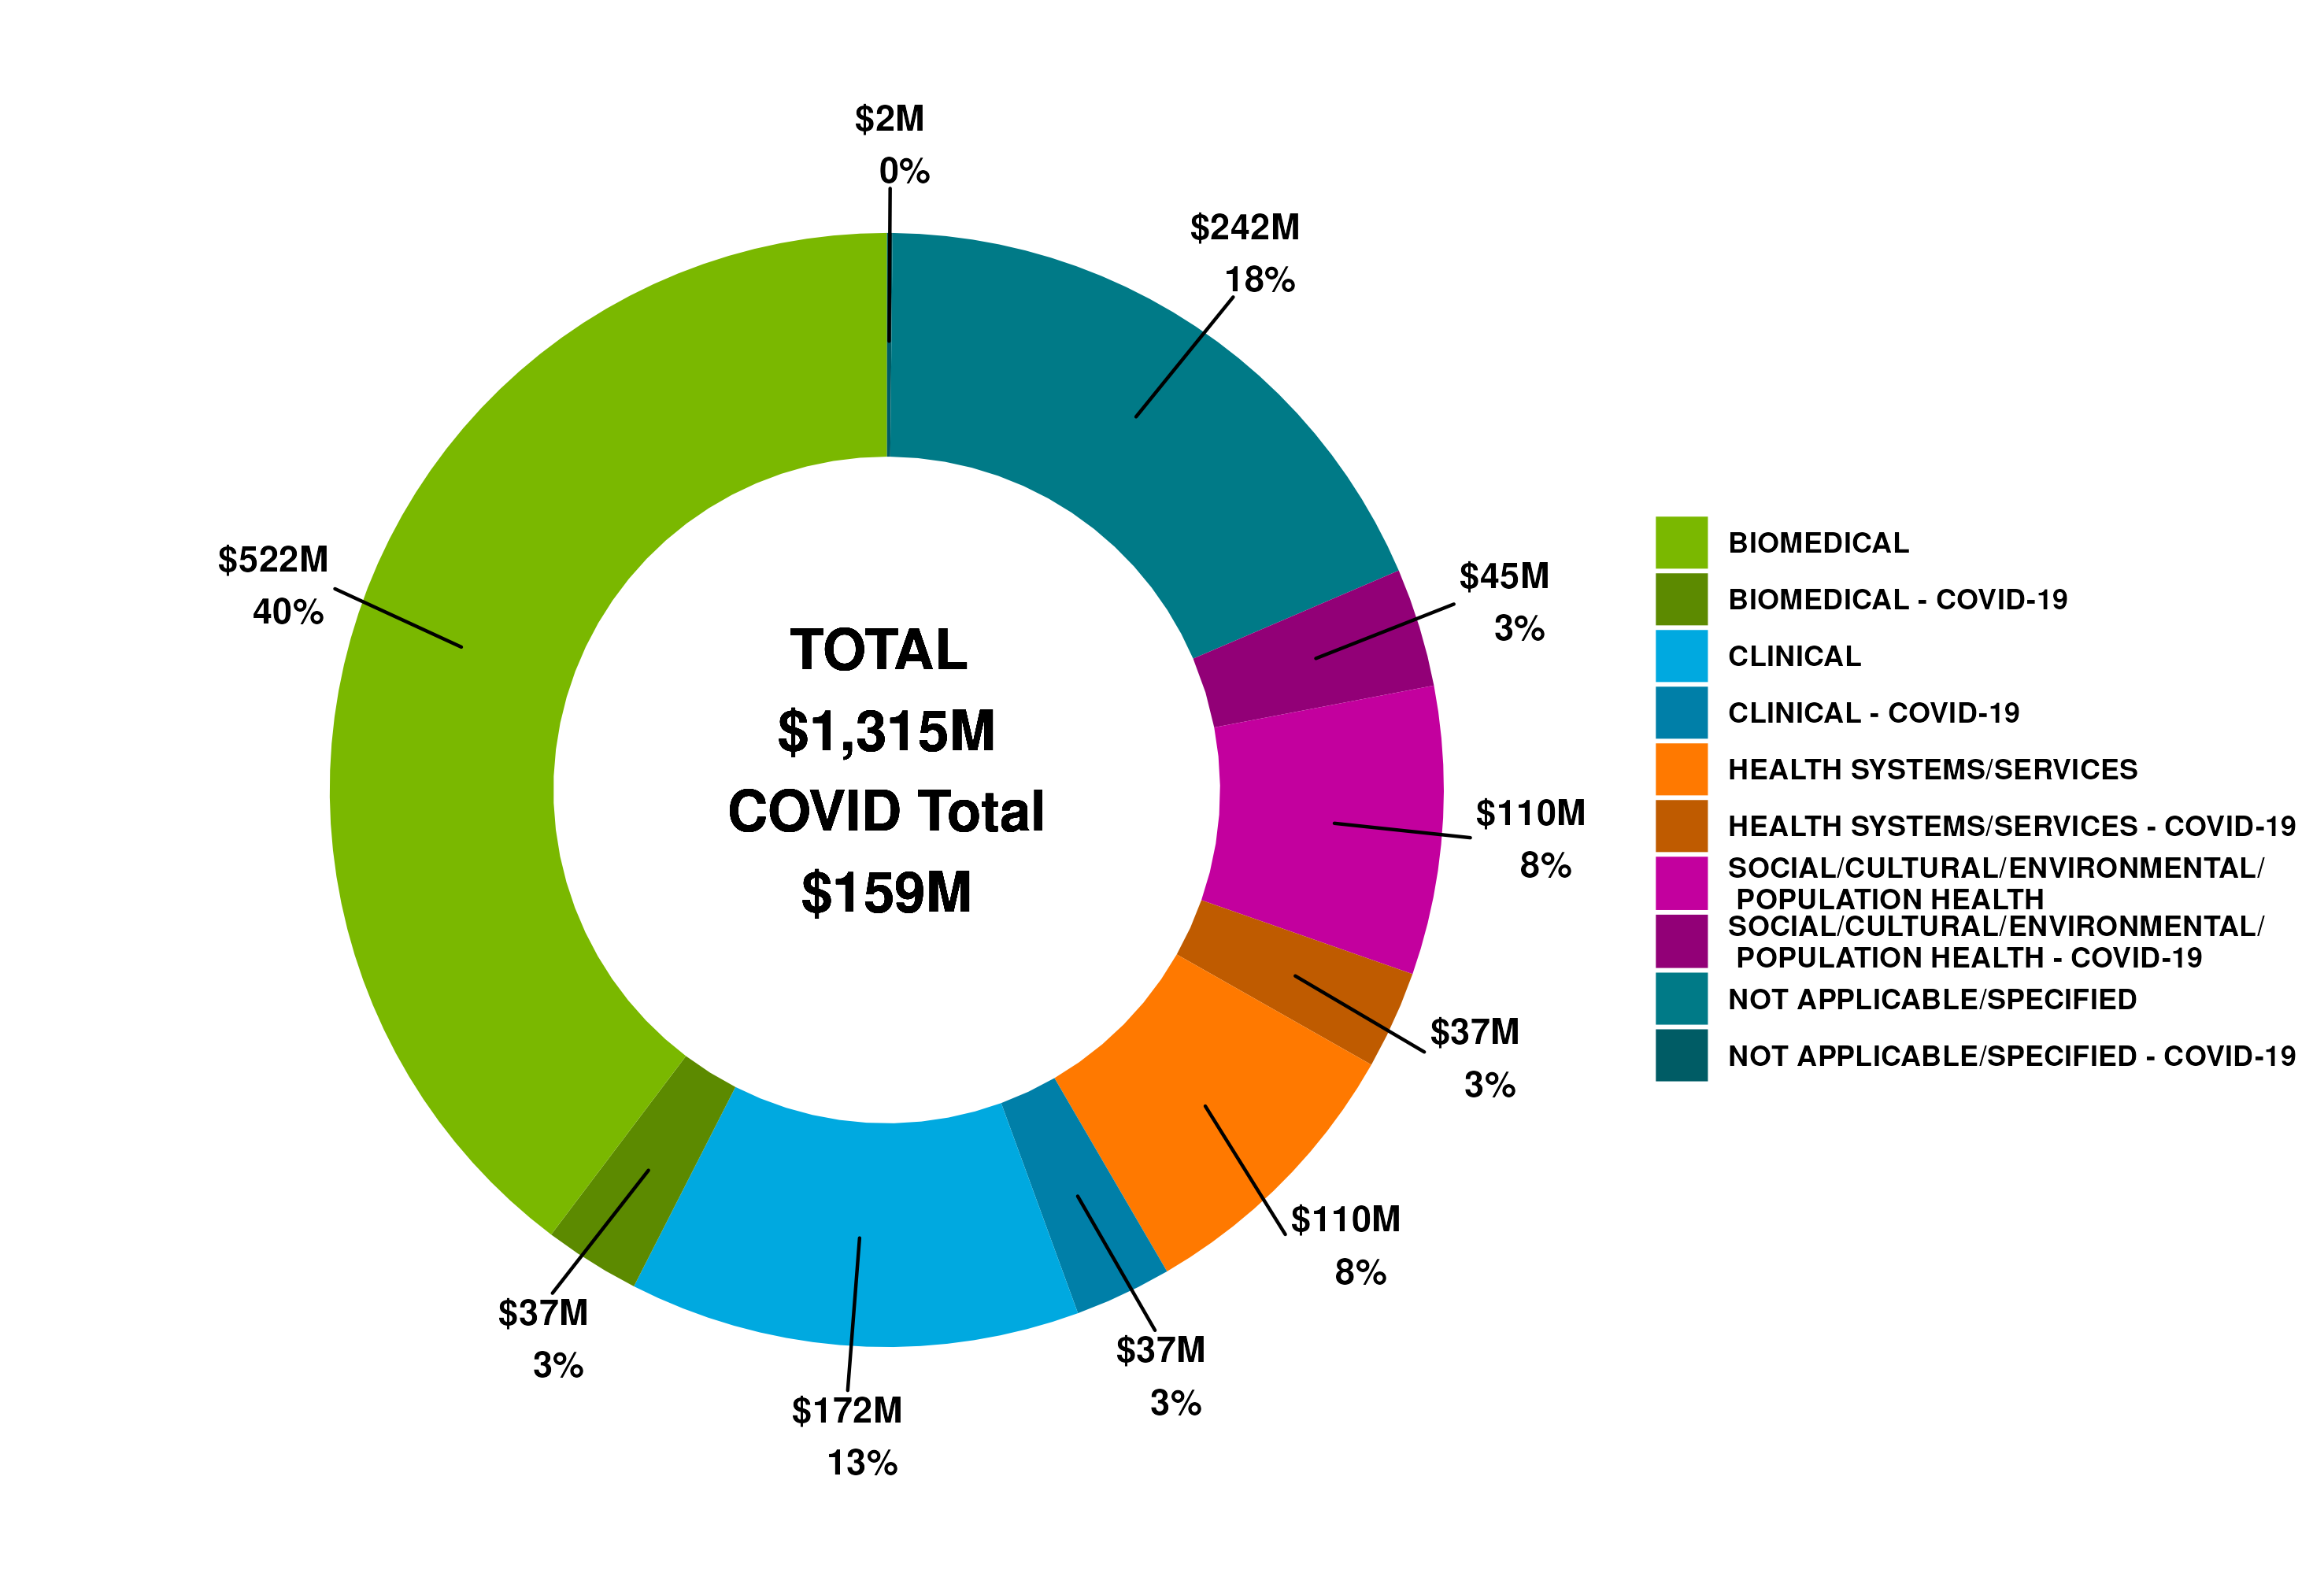
Figure 2: CIHR Investments by Primary Theme and COVID-19 funding 2021-22 (in millions of dollars)
Due to rounding, figures may not reconcile with other published information
Excludes operating expenditures and partner contributions
Primary theme designation is determined by the grantee at the time of application
COVID-19 funding is determined by granting to a COVID-19-specific funding competition
Figure 2 long description
Primary Theme
2021-22
Percentage Breakdown
Biomedical
non COVID-19
$522
40%
COVID-19
$37
3%
Clinical
non COVID-19
$172
13%
COVID-19
$37
3%
Health systems/services
non COVID-19
$110
8%
COVID-19
$37
3%
Social/Cultural/Environmental/Population Health
non COVID-19
$242
18%
COVID-19
$2
0.2%
Not applicable/Specified
non COVID-19
$110
8%
COVID-19
$45
3%
Total
$1,315
100%
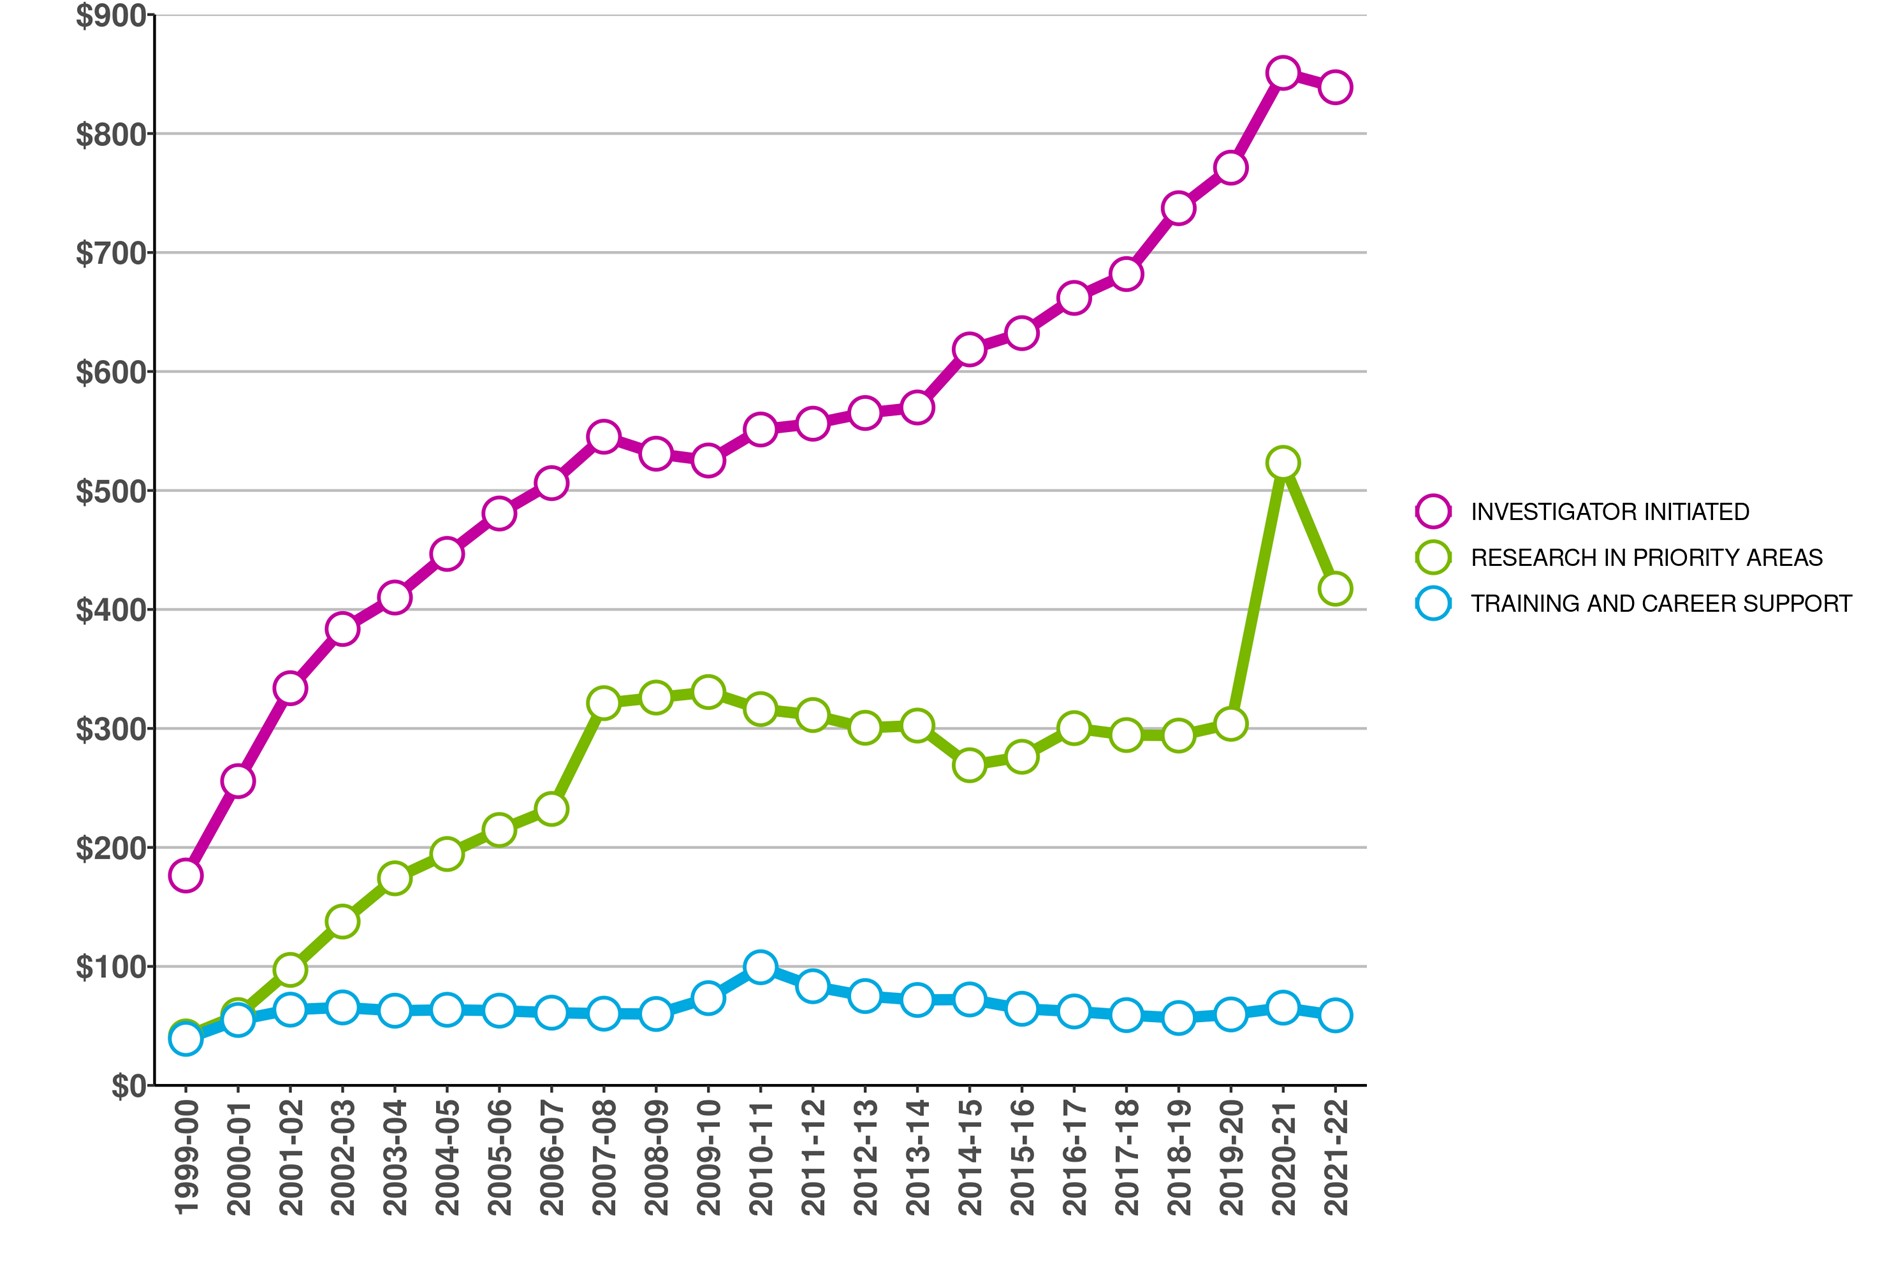
Figure 3: CIHR Fiscal Year Investments by Funding Type since 1999-00 (in millions of dollars)
Due to rounding, figures may not reconcile with other published information
Excludes operating expenditures and partner contributions
Figure 3 long description
Funding type
1999-00
2000-01
2001-02
2002-03
2003-04
2004-05
2005-06
2006-07
2007-08
2008-09
2009-10
2010-11
2011-12
2012-13
2013-14
2014-15
2015-16
2016-17
2017-18
2018-19
2019-20
2020-21
2021-22
Investigator Initiated
$176
$256
$334
$384
$410
$447
$481
$506
$545
$531
$525
$551
$556
$565
$570
$619
$632
$662
$682
$737
$771
$851
$839
Research in Priority Areas
$41
$59
$97
$138
$174
$194
$215
$232
$321
$326
$331
$316
$311
$301
$302
$269
$276
$300
$294
$294
$304
$523
$417
Training and Career Support
$39
$55
$64
$65
$63
$63
$63
$61
$60
$60
$73
$99
$83
$75
$72
$72
$64
$62
$59
$57
$60
$65
$59
Total
$257
$370
$494
$587
$647
$705
$758
$800
$927
$917
$929
$967
$951
$941
$944
$960
$973
$1,024
$1,035
$1,088
$1,135
$1,439
$1,315
Figure 4: CIHR Investments by Region in 2021-22 (in millions of dollars)
Due to rounding, figures may not reconcile with other published information
Excludes operating expenditures, partner contributions and direct payments
Figure 4 long description
Region
CIHR Expenditures 2021-22
Number of new and ongoing funded applications 2021-22
Alberta
$135
844
British Columbia
$160
999
Manitoba
$35
234
New Brunswick
$1.4
21
Newfoundland & Labrador
$7.8
49
North West Territories
$2.1
4
Nova Scotia
$30
182
Nunavut
$0.9
2
Ontario
$575
3,329
Prince Edward Island
$0.1
3
Quebec
$336
2,091
Saskatchewan
$20
98
Yukon
$1.2
3
Figure 5a: Number of New and Ongoing Projects
Due to rounding as well as changes in methodology, figures may not reconcile with other published information.
Excludes operating expenditures and partner contributions.
As of March 2021, an updated method is used to determine international collaborators based on affiliations at the time of grant submission.
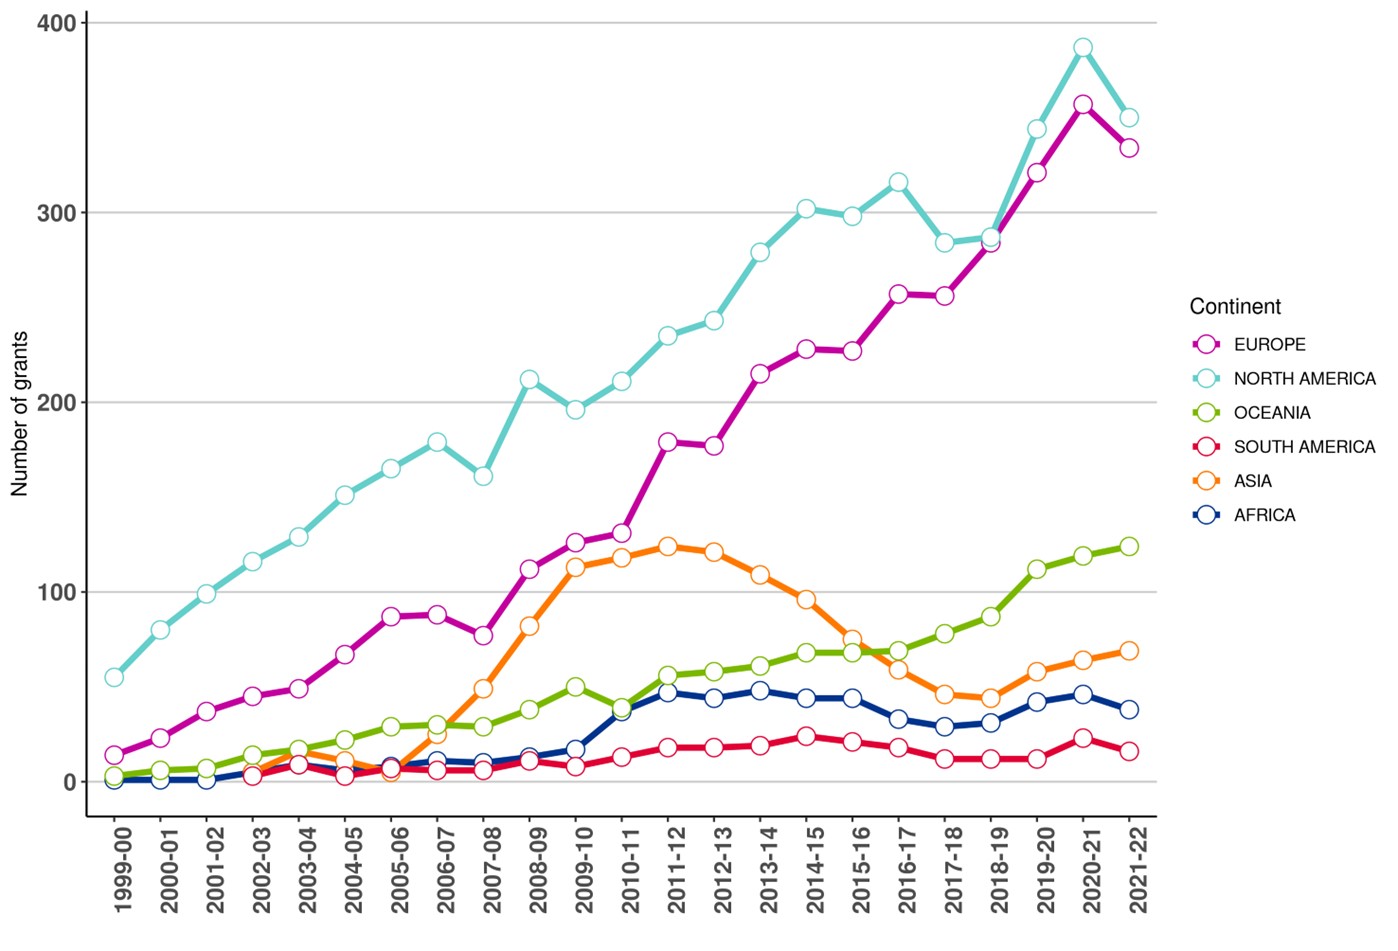
Figure 5a long description
Continent
1999-00
2000-01
2001-02
2002-03
2003-04
2004-05
2005-06
2006-07
2007-08
2008-09
2009-10
2010-11
2011-12
2012-13
2013-14
2014-15
2015-16
2016-17
2017-18
2018-19
2019-20
2020-21
2021-22
Africa
1
1
1
5
9
6
8
11
10
13
17
37
47
44
48
44
44
33
29
31
42
46
38
Europe
14
23
37
45
49
67
87
88
77
112
126
131
179
177
215
228
227
257
256
284
321
357
334
North America
55
80
99
116
129
151
165
179
161
212
196
211
235
243
279
302
298
316
284
287
344
387
350
Oceania
3
6
7
14
17
22
29
30
29
38
50
39
56
58
61
68
68
69
78
87
112
119
124
Asia
0
0
0
5
16
11
5
25
49
82
113
118
124
121
109
96
75
59
46
44
58
64
69
South America
0
0
0
3
9
3
7
6
6
11
8
13
18
18
19
24
21
18
12
12
12
23
16
Figure 5b: Proportion of CIHR Grants with International linkages since 1999-00
Due to rounding as well as changes in methodology, figures may not reconcile with other published information.
Excludes operating expenditures and partner contributions.
As of March 2021, an updated method is used to determine international collaborators based on affiliations at the time of grant submission.
Figure 5b long description
Proportion
1999-00
2000-01
2001-02
2002-03
2003-04
2004-05
2005-06
2006-07
2007-08
2008-09
2009-10
2010-11
2011-12
2012-13
2013-14
2014-15
2015-16
2016-17
2017-18
2018-19
2019-20
2020-21
2021-22
Percentage of total CIHR investments
4.1%
4.2%
5.4%
6%
6.7%
6.4%
6.5%
6.9%
6.8%
8.3%
10.7%
10.3%
11.7%
12.6%
13.6%
14%
14.2%
15.2%
15.1%
14.7%
15%
17.1%
15.7%
Percentage of total # of CIHR grants
3.1%
2.9%
3%
3.6%
3.8%
4.4%
4.7%
5.3%
5.1%
6.3%
6.9%
7.4%
8.9%
9.2%
11.1%
11.6%
12%
12.8%
12.4%
12.6%
13.5%
14%
13.4%
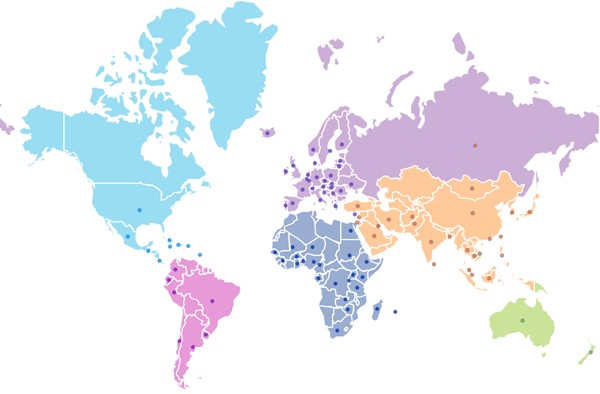
Figure 6: Countries with an International Linkage to a CIHR grants since 1999-00
Due to changes in methodology, figures may not reconcile with other published information
Figure 6 long description
Countries
Afghanistan
Argentina
Australia
Austria
Bangladesh
Barbados
Belgium
Benin
Brazil
Burkina Faso
Cambodia
Cameroon
Chile
China
Colombia
Costa Rica
Croatia
Cuba
Cyprus
Czech Republic
Democratic Republic of the Congo
Denmark
Ecuador
Egypt
England
Ethiopia
Finland
France
Gabon
Germany
Ghana
Greece
Guatemala
Guinea
Haiti
Hong Kong
Hungary
Iceland
India
Indonesia
Iran
Ireland
Israel
Italy
Jamaica
Japan
Kenya
Kuwait
Lao People's Democratic Republic
Latvia
Lebanon
Lithuania
Luxembourg
Madagascar
Malaysia
Mali
Mauritius
Mexico
Mongolia
Netherlands
New Zealand
Niger
Nigeria
Norway
Pakistan
Peru
Philippines
Poland
Portugal
Puerto Rico
Romania
Russia
Rwanda
Saudi Arabia
Scotland
Senegal
Singapore
Slovakia
South Africa
South Korea
Spain
Sri Lanka
Sudan
Sweden
Switzerland
Taiwan
Tanzania
Thailand
Turkey
Uganda
Ukraine
United Kingdom
United States
Uruguay
Vietnam
Yugoslavia
Zambia
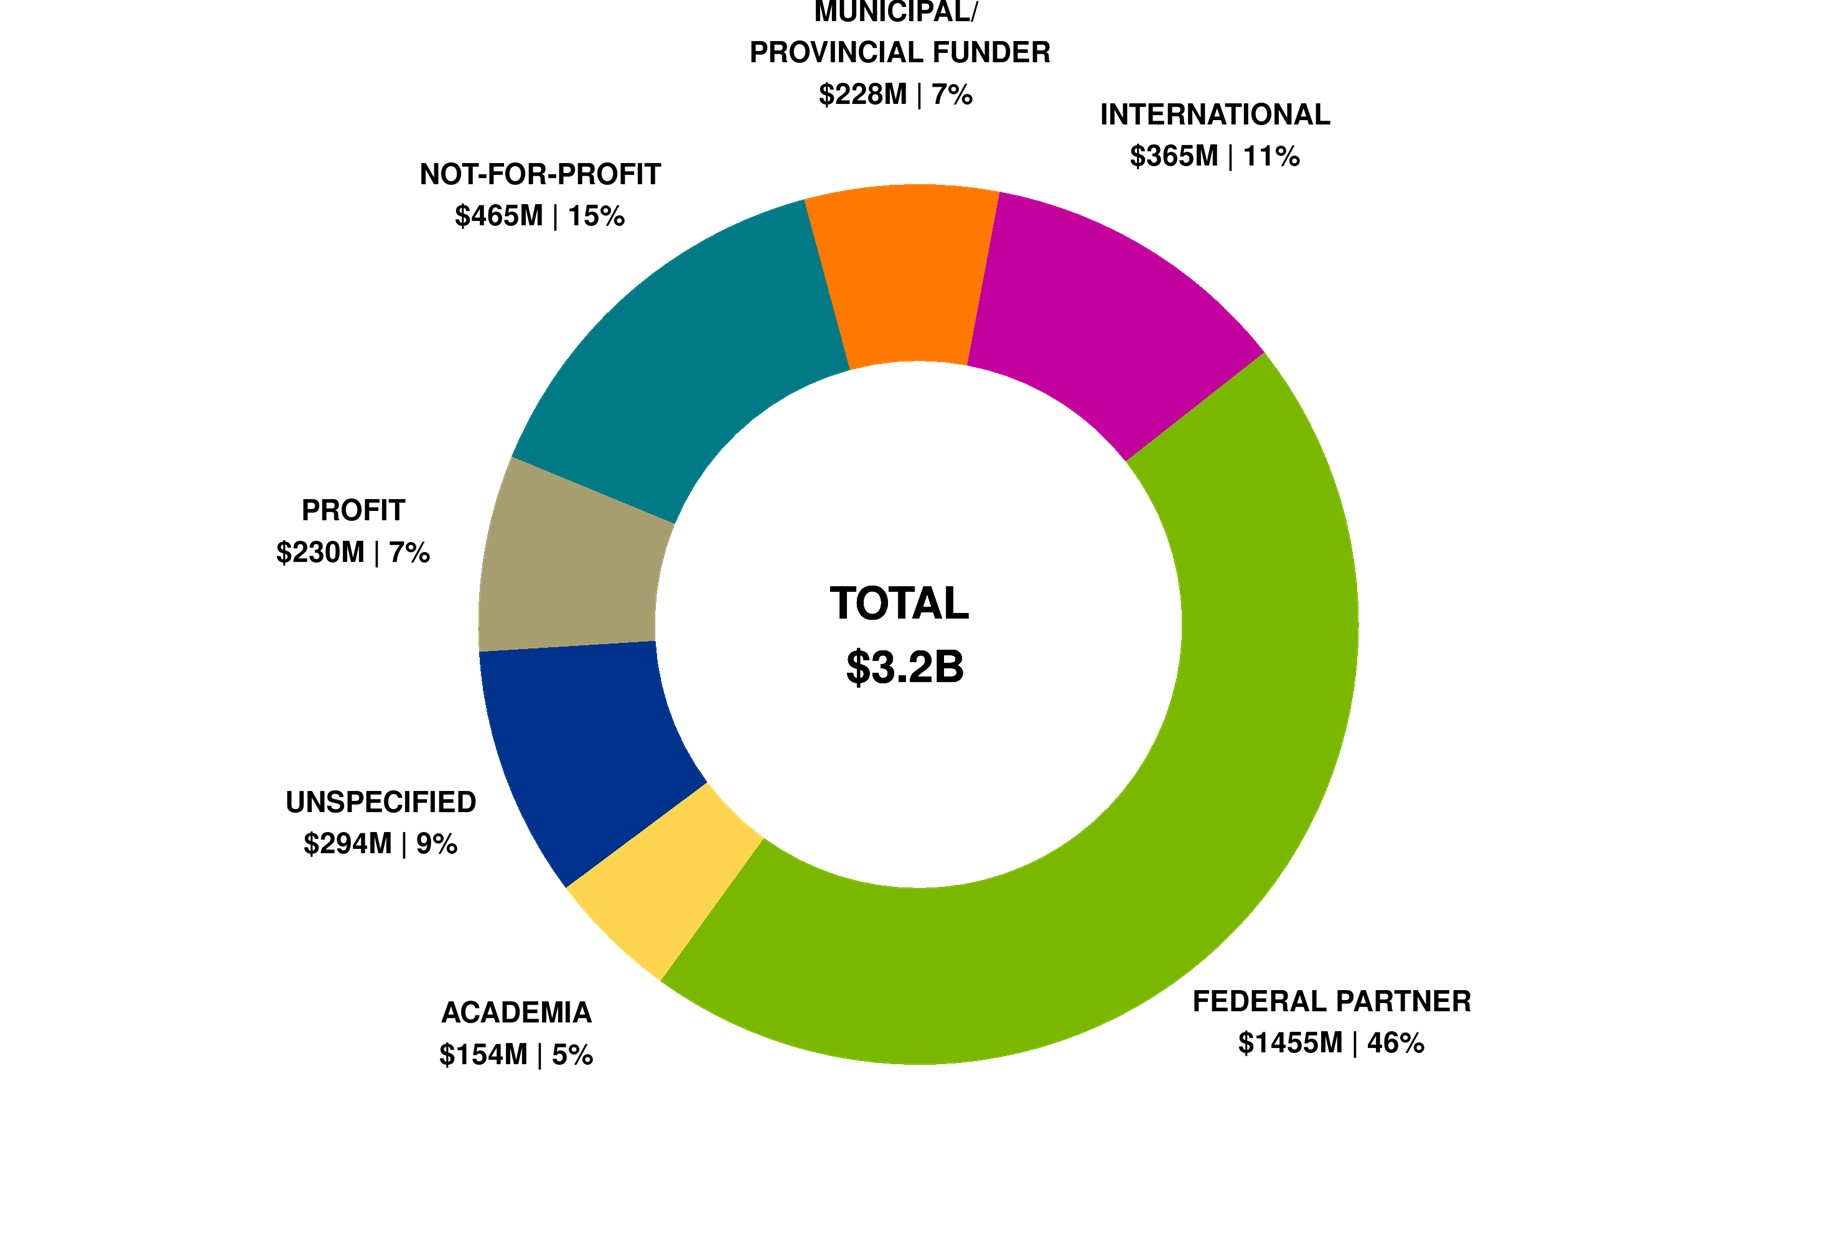
Zimbabwe
Figure 7: Leveraged Partner Funding by Sector (in millions of dollars) – Cumulative totals from 1999-00 to 2021-22
Due to rounding, figures may not reconcile with other published information
Includes partner contributions administered by CIHR, in kind and direct contributions from partner directly to the researcher
Includes both competition and applicant partner contributions where there may or may not be a formal agreement with CIHR
Figure 7 long description
Sector
Total
Percentage
Academia
$154
4.8%
Federal partners
$1,455
45.6%
International
$365
11.4%
Municipal/Provincial funder
$228
7.1%
Not-for-profit
$465
14.6%
Profit
$230
7.2%
Unspecified
$294
9.2%
Total
$3,192
100%
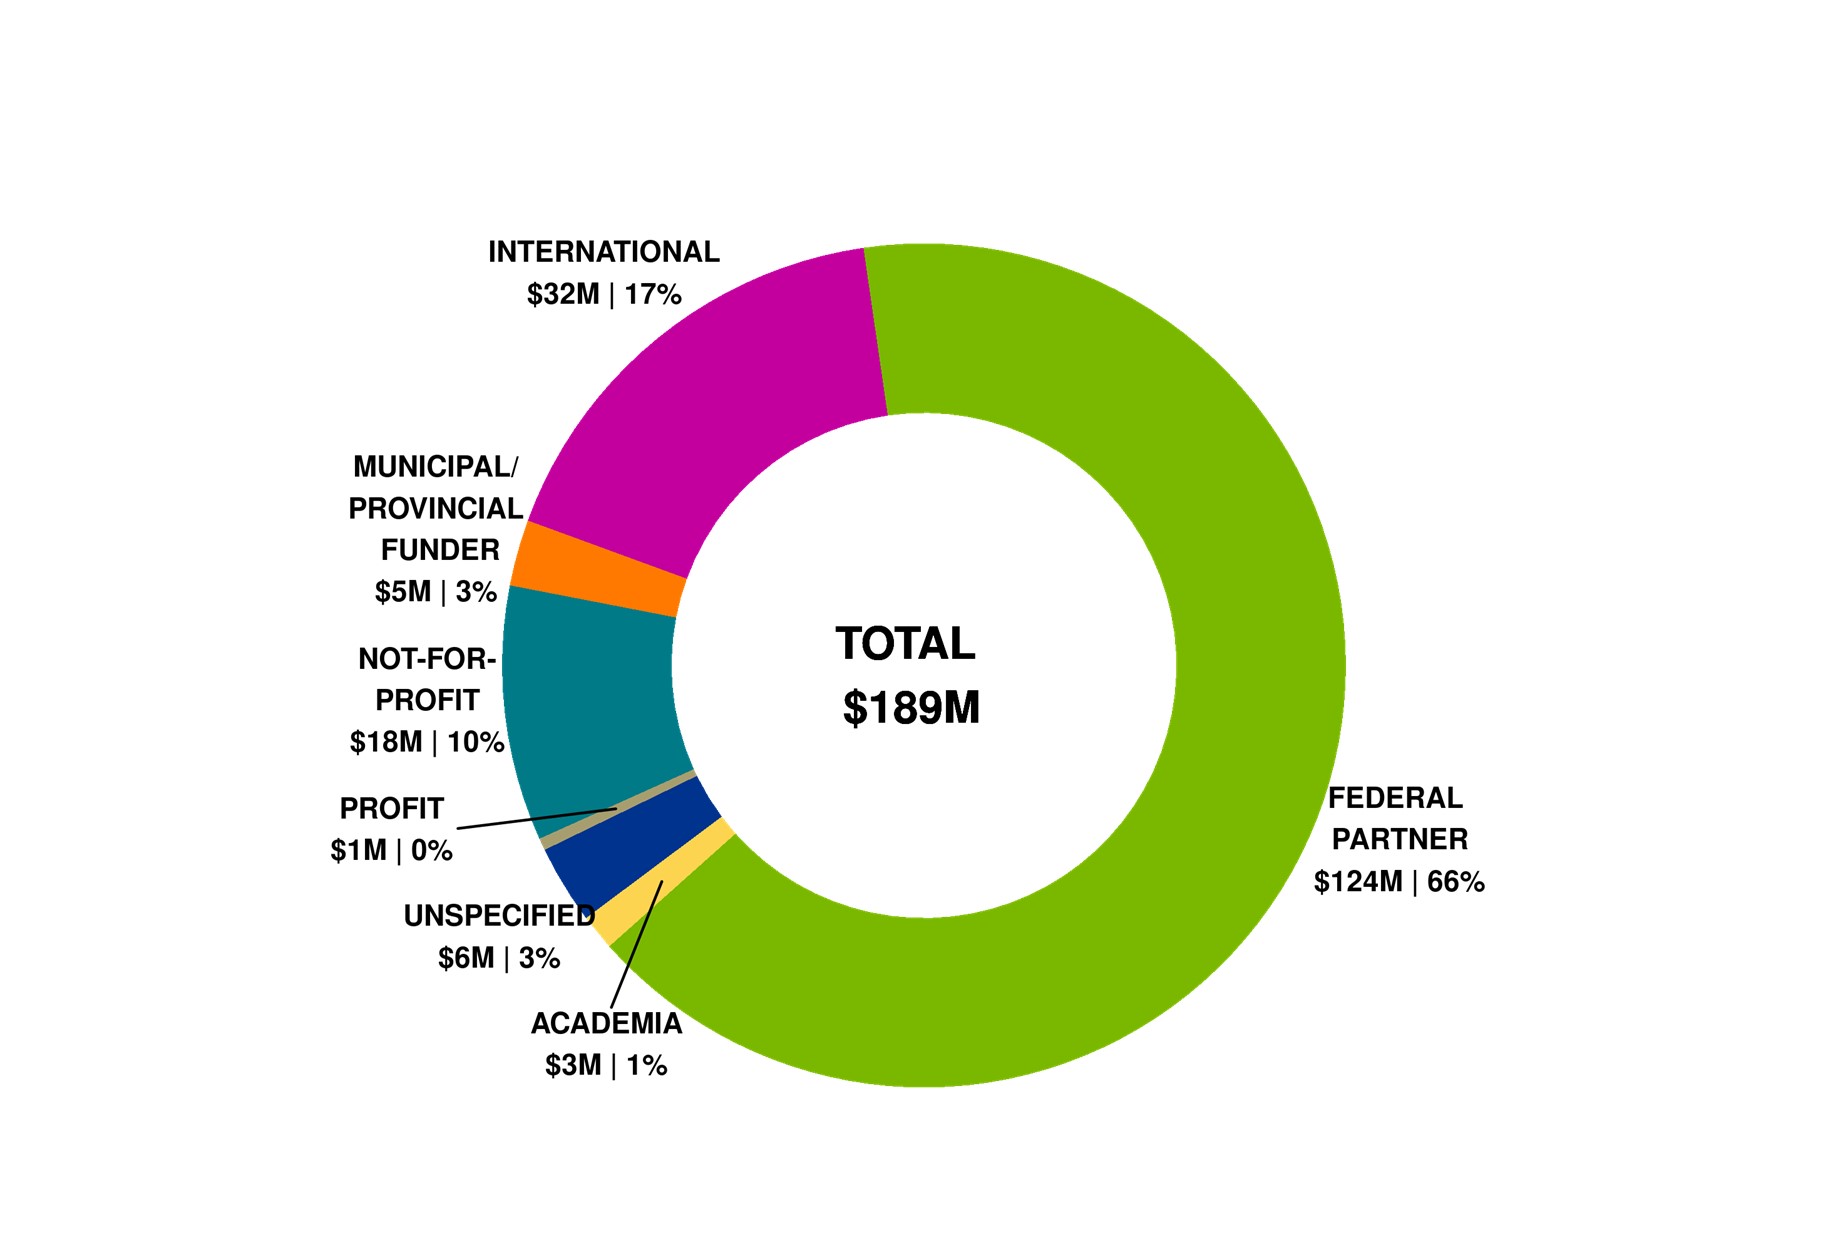
Figure 8: Leveraged Partner Funding by Sector (in millions of dollars) – 2021-22
Due to rounding, figures may not reconcile with other published information
Includes partner contributions administered by CIHR, in kind and direct contributions from partner directly to the researcher
Includes both competition and applicant partner contributions where there may or may not be a formal agreement with CIHR
Figure 8 long description
Sector
Total
Percentage
Academia
$3
1%
Federal partner
$124
66%
International
$32
17%
Municipal/Provincial funder
$5
3%
Not-for-profit
$18
10%
Profit
$1
0%
Unspecified
$6
3%
Total
$189
100%
2020-2021
Figure 1: CIHR Fiscal Year Investments by Primary Theme since 1999-00 (in millions of dollars)
Due to rounding, figures may not reconcile with other published information
Excludes operating expenditures and partner contributions
Primary theme designation is determined by the grantee at the time of application
Figure 1 long description
Primary theme
1999-00
2000-01
2001-02
2002-03
2003-04
2004-05
2005-06
2006-07
2007-08
2008-09
2009-10
2010-11
2011-12
2012-13
2013-14
2014-15
2015-16
2016-17
2017-18
2018-19
2019-20
2020-21
Biomedical
$88
$160
$250
$312
$354
$381
$419
$439
$444
$474
$463
$475
$458
$455
$454
$471
$459
$478
$472
$500
$510
$643
Clinical
$13
$27
$47
$64
$69
$77
$82
$85
$101
$110
$126
$129
$130
$129
$130
$134
$132
$133
$140
$153
$164
$247
Health systems/services
$0.7
$5
$16
$25
$32
$36
$36
$34
$42
$48
$55
$58
$57
$64
$61
$66
$73
$82
$80
$86
$94
$120
Social/Cultural/Environmental/Population Health
$3
$9
$25
$38
$47
$56
$60
$69
$84
$85
$90
$91
$91
$92
$90
$90
$82
$83
$91
$92
$108
$160
Not applicable/Specified
$152
$168
$157
$148
$144
$155
$161
$172
$255
$199
$195
$213
$215
$201
$210
$197
$227
$248
$252
$258
$259
$269
Total
$257
$370
$494
$587
$647
$705
$758
$800
$927
$917
$929
$967
$951
$941
$944
$960
$973
$1,024
$1,035
$1,088
$1,135
$1,439
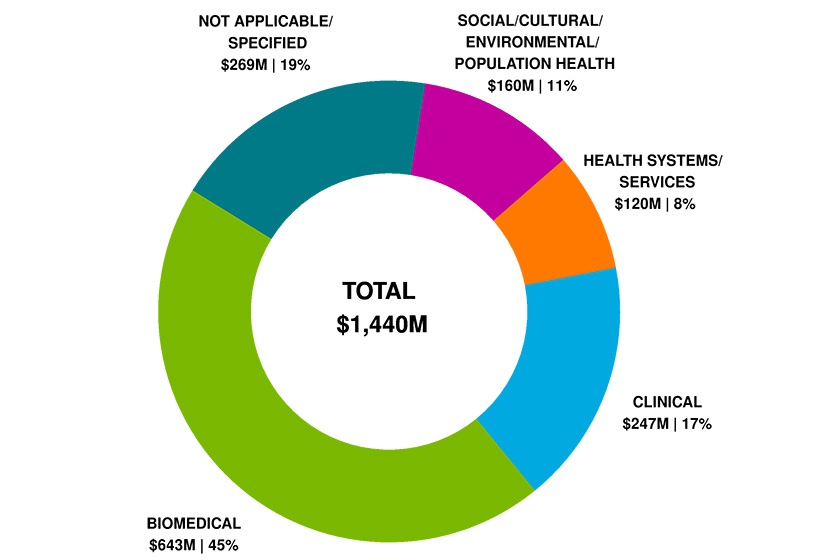
Figure 2: CIHR Investments by Primary Theme 2020-21 (in millions of dollars)
Due to rounding, figures may not reconcile with other published information
Excludes operating expenditures and partner contributions
Primary theme designation is determined by the grantee at the time of application
Figure 2 long description
Primary Theme
2020-21
Percentage Breakdown
Biomedical
$643
45%
Clinical
$247
17%
Health systems/services
$120
8%
Social/Cultural/Environmental/Population Health
$160
11%
Not applicable/Specified
$269
19%
Total
$1,440
100%
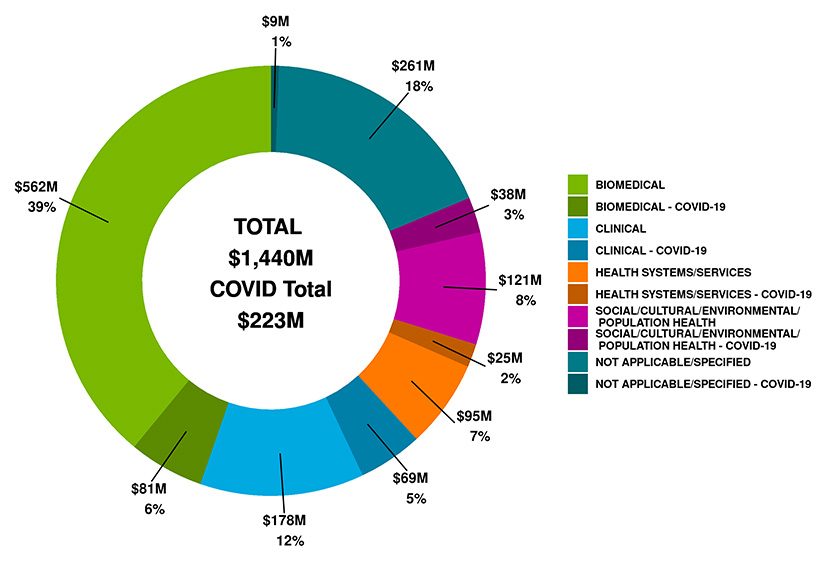
Figure 2: CIHR Investments by Primary Theme and COVID-19 funding 2020-21 (in millions of dollars)
Due to rounding, figures may not reconcile with other published information
Excludes operating expenditures and partner contributions
Primary theme designation is determined by the grantee at the time of application
COVID-19 funding is determined by granting to a COVID-19-specific funding competition
Figure 2 long description
Primary Theme
2020-21
Percentage Breakdown
Biomedical
non COVID-19
$562
39%
COVID-19
$81
6%
Clinical
non COVID-19
$178
12%
COVID-19
$69
5%
Health systems/services
non COVID-19
$95
7%
COVID-19
$25
2%
Social/Cultural/Environmental/Population Health
non COVID-19
$121
8%
COVID-19
$38
3%
Not applicable/Specified
non COVID-19
$261
18%
COVID-19
$9
1%
Total
$1,439
101%
Figure 3: CIHR Fiscal Year Investments by Funding Type since 1999-00 (in millions of dollars)
Due to rounding, figures may not reconcile with other published information
Excludes operating expenditures and partner contributions
Figure 3 long description
Funding type
1999-00
2000-01
2001-02
2002-03
2003-04
2004-05
2005-06
2006-07
2007-08
2008-09
2009-10
2010-11
2011-12
2012-13
2013-14
2014-15
2015-16
2016-17
2017-18
2018-19
2019-20
2020-21
Investigator Initiated
$176
$256
$334
$384
$410
$447
$481
$506
$545
$531
$525
$551
$556
$565
$570
$619
$632
$662
$682
$737
$771
$851
Research in Priority Areas
$41
$59
$97
$138
$174
$194
$215
$232
$321
$326
$331
$316
$311
$301
$302
$269
$276
$300
$294
$294
$304
$523
Training and Career Support
$39
$55
$64
$65
$63
$63
$63
$61
$60
$60
$73
$99
$83
$75
$72
$72
$64
$62
$59
$57
$60
$65
Total
$257
$370
$494
$587
$647
$705
$758
$800
$927
$917
$929
$967
$951
$941
$944
$960
$973
$1,024
$1,035
$1,088
$1,135
$1,439
Figure 4: CIHR Investments by Region in 2020-21 (in millions of dollars)
Due to rounding, figures may not reconcile with other published information
Excludes operating expenditures, partner contributions and direct payments
Figure 4 long description
Region
CIHR Expenditures 2020-21
Number of new and ongoing funded applications 2020-21
Alberta
$146
882
British Columbia
$184
1,153
Manitoba
$40
234
New Brunswick
$1.6
20
Newfoundland & Labrador
$6.5
50
North West Territories
$2.5
5
Nova Scotia
$34
184
Nunavut
$0.9
2
Ontario
$626
3503
Prince Edward Island
$0.4
4
Quebec
$358
2,219
Saskatchewan
$29
117
Yukon
$0.5
2
Figure 5a: Number of New and Ongoing Projects
Due to rounding as well as changes in methodology, figures may not reconcile with other published information
Excludes operating expenditures and partner contributions
Figure 5a long description
Continent
1999-00
2000-01
2001-02
2002-03
2003-04
2004-05
2005-06
2006-07
2007-08
2008-09
2009-10
2010-11
2011-12
2012-13
2013-14
2014-15
2015-16
2016-17
2017-18
2018-19
2019-20
2020-21
Africa
0
0
0
3
9
5
6
9
8
8
11
30
38
37
41
37
34
30
27
29
39
41
Europe
5
8
11
19
27
48
66
68
63
94
108
117
157
158
202
210
204
231
229
253
291
316
North America
9
14
17
33
64
100
124
144
138
177
169
188
213
229
267
292
285
297
265
266
319
335
Oceania
1
2
4
7
14
15
19
22
22
27
40
27
49
52
56
64
62
64
70
81
101
109
Asia
0
0
0
5
9
9
2
23
47
74
106
112
115
116
105
92
71
53
43
41
55
57
South America
0
0
0
1
7
3
5
6
6
10
6
11
14
15
17
21
18
15
10
8
8
14
Figure 5b: Proportion of CIHR Grants with International linkages since 1999-00
Due to rounding as well as changes in methodology, figures may not reconcile with other published information
Excludes operating expenditures and partner contributions
Figure 5b long description
Proportion
1999-00
2000-01
2001-02
2002-03
2003-04
2004-05
2005-06
2006-07
2007-08
2008-09
2009-10
2010-11
2011-12
2012-13
2013-14
2014-15
2015-16
2016-17
2017-18
2018-19
2019-20
2020-21
Percentage of total CIHR
1.1%
1.0%
1.7%
2.0%
3.2%
4.0%
3.9%
4.7%
5.0%
5.5%
8.3%
7.6%
9.3%
10.4%
12.6%
13.0%
13.0%
13.9%
13.6%
13.2%
13.6%
14.9%
Percentage of total # of CIHR grants
0.7%
0.6%
0.6%
1.2%
2.1%
3.0%
3.5%
4.2%
4.4%
5.4%
6.1%
6.6%
8.0%
8.6%
10.6%
11.1%
11.2%
12.0%
11.5%
11.5%
12.4%
12.4%
Figure 6: Countries with an International Linkage to a CIHR grants since 1999-00
Due to changes in methodology, figures may not reconcile with other published information
Figure 6 long description
Countries
Afghanistan
Argentina
Australia
Austria
Bangladesh
Barbados
Belgium
Benin
Brazil
Burkina Faso
Cambodia
Cameroon
Chile
China
Colombia
Costa Rica
Croatia
Cuba
Cyprus
Czech Republic
Democratic Republic of the Congo
Denmark
Ecuador
Egypt
England
Ethiopia
Finland
France
Gabon
Germany
Ghana
Greece
Guatemala
Guinea
Haiti
Hong Kong
Hungary
Iceland
India
Indonesia
Iran
Ireland
Israel
Italy
Jamaica
Japan
Kenya
Kuwait
Lao People's Democratic Republic
Latvia
Lebanon
Lithuania
Luxembourg
Malaysia
Mali
Mauritius
Mexico
Mongolia
Netherlands
New Zealand
Niger
Nigeria
Norway
Pakistan
Peru
Philippines
Poland
Portugal
Puerto Rico
Romania
Russia
Rwanda
Saudi Arabia
Scotland
Senegal
Singapore
Slovakia
South Africa
South Korea
Spain
Sri Lanka
Sudan
Sweden
Switzerland
Taiwan
Tanzania
Thailand
Turkey
Uganda
Ukraine
United Kingdom
United States
Uruguay
Vietnam
Yugoslavia
Zambia
Zimbabwe
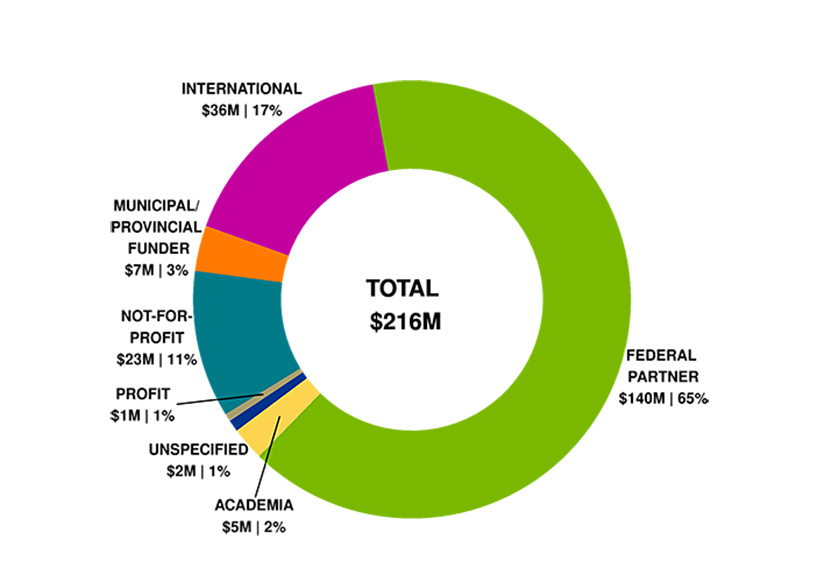
Figure 7: Leveraged Partner Funding by Sector (in millions of dollars) – Cumulative totals from 1999-00 to 2020-21
Due to rounding, figures may not reconcile with other published information
Includes partner contributions administered by CIHR, in kind and direct contributions from partner directly to the researcher
Includes both competition and applicant partner contributions where there may or may not be a formal agreement with CIHR
Figure 7 long description
Sector
Total
Percentage
Academia
$151
5%
Federal partners
$1,331
44%
International
$333
11%
Municipal/Provincial funder
$223
7%
Not-for-profit
$447
15%
Profit
$230
8%
Unspecified
$289
10%
Total
$3,003
100%
Figure 8: Leveraged Partner Funding by Sector (in millions of dollars) – 2020-21
Due to rounding, figures may not reconcile with other published information
Includes partner contributions administered by CIHR, in kind and direct contributions from partner directly to the researcher
Includes both competition and applicant partner contributions where there may or may not be a formal agreement with CIHR
Figure 8 long description
Sector
Total
Percentage
Academia
$5
2%
Federal partner
$140
65%
International
$36
17%
Municipal/Provincial funder
$7
3%
Not-for-profit
$23
11%
Profit
$1
1%
Unspecified
$2
1%
Total
$216
100%
2019-2020
Figure 1: CIHR Fiscal Year Investments by Primary Theme since 1999-00 (in millions of dollars)
Due to rounding, figures may not reconcile with other published information
Excludes operating expenditures and partner contributions
Primary theme designation is determined by the grantee at the time of application
Figure 1 long description
Primary theme
1999-00
2000-01
2001-02
2002-03
2003-04
2004-05
2005-06
2006-07
2007-08
2008-09
2009-10
2010-11
2011-12
2012-13
2013-14
2014-15
2015-16
2016-17
2017-18
2018-19
2019-20
Biomedical
$88
$160
$250
$312
$354
$381
$419
$439
$444
$474
$463
$475
$458
$455
$454
$471
$459
$478
$472
$500
$510
Clinical
$13
$27
$47
$64
$69
$77
$82
$85
$101
$110
$126
$129
$130
$129
$130
$134
$132
$133
$140
$153
$164
Health systems/services
$0.7
$5
$16
$25
$32
$36
$36
$34
$42
$48
$55
$58
$57
$64
$61
$66
$73
$82
$80
$86
$94
Social/Cultural/Environmental/Population Health
$3
$9
$25
$38
$47
$56
$60
$69
$84
$85
$90
$91
$91
$92
$90
$90
$82
$83
$91
$92
$108
Not applicable/Specified
$152
$168
$157
$148
$144
$155
$161
$172
$255
$199
$195
$213
$215
$201
$210
$197
$227
$248
$252
$258
$259
Total
$257
$370
$494
$587
$647
$705
$758
$800
$927
$917
$929
$967
$951
$941
$944
$960
$973
$1,024
$1,035
$1,088
$1,135
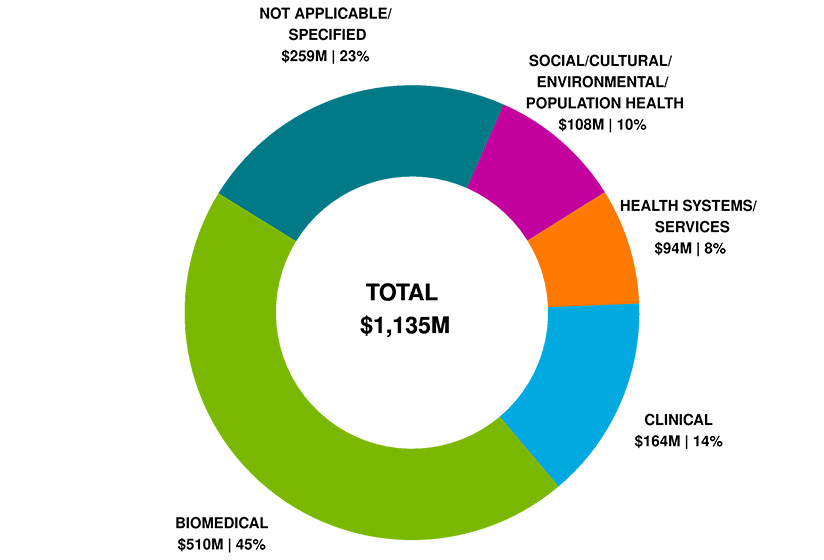
Figure 2: CIHR Investments by Primary Theme 2019-20 (in millions of dollars)
Due to rounding, figures may not reconcile with other published information
Excludes operating expenditures and partner contributions
Primary theme designation is determined by the grantee at the time of the application
Figure 2 long description
Primary Theme
2019-20
Percentage Breakdown
Biomedical
$510
45%
Clinical
$164
14%
Health systems/services
$94
8%
Social/Cultural/Environmental/Population Health
$108
10%
Not applicable/Specified
$259
23%
Total
$1,135
100%
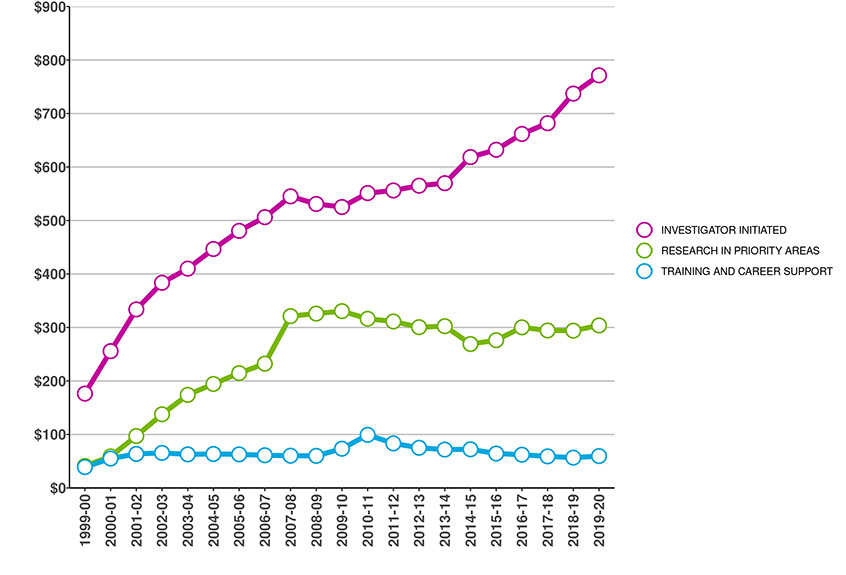
Figure 3: CIHR Fiscal Year Investments by Funding Type since 1999-00 (in millions of dollars)
Due to rounding, figures may not reconcile with other published information
Excludes operating expenditures and partner contributions
Figure 3 long description
Funding type
1999-00
2000-01
2001-02
2002-03
2003-04
2004-05
2005-06
2006-07
2007-08
2008-09
2009-10
2010-11
2011-12
2012-13
2013-14
2014-15
2015-16
2016-17
2017-18
2018-19
2019-20
Investigator Initiated
$176
$256
$334
$384
$410
$447
$481
$506
$545
$531
$525
$551
$556
$565
$570
$619
$632
$662
$682
$737
$771
Research in Priority Areas
$41
$59
$97
$138
$174
$194
$215
$232
$321
$326
$331
$316
$311
$301
$302
$269
$276
$300
$294
$294
$304
Training and Career Support
$39
$55
$64
$65
$63
$63
$63
$61
$60
$60
$73
$99
$83
$75
$72
$72
$64
$62
$59
$57
$60
Total
$257
$370
$494
$587
$647
$705
$758
$800
$927
$917
$929
$967
$951
$941
$944
$960
$973
$1,024
$1,035
$1,088
$1,135
Figure 4: CIHR Investments by Region in 2019-20 (in millions of dollars)
Due to rounding, figures may not reconcile with other published information
Excludes operating expenditures, partner contributions and direct payments
Figure 4 long description
Region
CIHR Expenditures 2019-20
Number of new and ongoing funded applications 2019-20
Alberta
$100
812
British Columbia
$155
1113
Manitoba
$24
208
New Brunswick
$1.3
20
Newfoundland & Labrador
$4.7
54
North West Territories
$2.2
6
Nova Scotia
$24
184
Nunavut
$0.5
2
Ontario
$490
3636
Prince Edward Island
$0.9
5
Quebec
$229
2107
Saskatchewan
$23
105
Yukon
$0
0
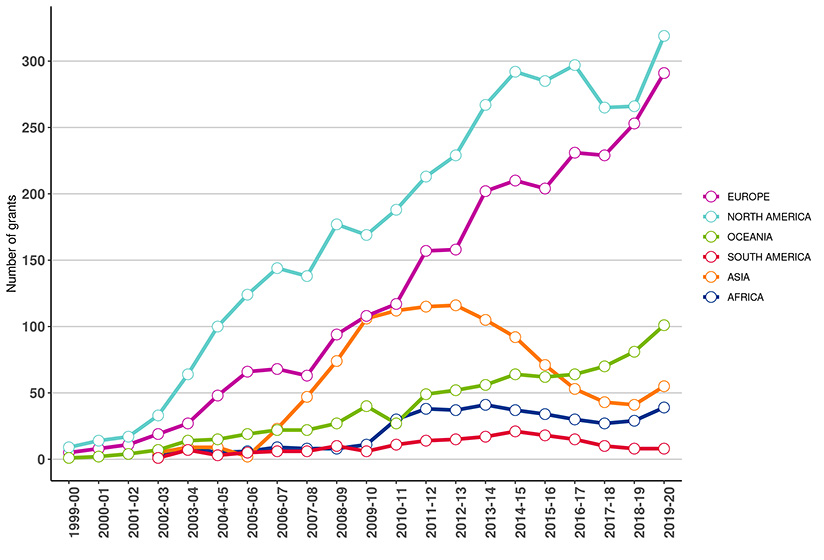
Figure 5a: Number of New and Ongoing Projects
Due to rounding as well as changes in methodology, figures may not reconcile with other published information
Excludes operating expenditures and partner contributions
Figure 5a long description
Continent
1999-00
2000-01
2001-02
2002-03
2003-04
2004-05
2005-06
2006-07
2007-08
2008-09
2009-10
2010-11
2011-12
2012-13
2013-14
2014-15
2015-16
2016-17
2017-18
2018-19
2019-20
Africa
0
0
0
3
9
5
6
9
8
8
11
30
38
37
41
37
34
30
27
29
39
Europe
5
8
11
19
27
48
66
68
63
94
108
117
157
158
202
210
204
231
229
253
291
North America
9
14
17
33
64
100
124
144
138
177
169
188
213
229
267
292
285
297
265
266
319
Oceania
1
2
4
7
14
15
19
22
22
27
40
27
49
52
56
64
62
64
70
81
101
Asia
0
0
0
5
9
9
2
23
47
74
106
112
115
116
105
92
71
53
43
41
55
South America
0
0
0
1
7
3
5
6
6
10
6
11
14
15
17
21
18
15
10
8
8
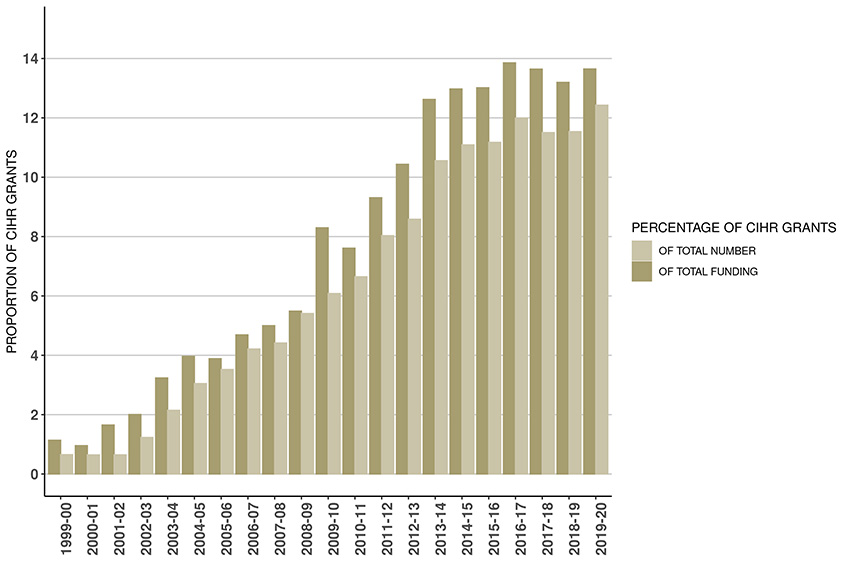
Figure 5b: Proportion of CIHR Grants with International linkages since 1999-00
Due to rounding as well as changes in methodology, figures may not reconcile with other published information
Excludes operating expenditures and partner contributions
Figure 5b long description
Proportion
1999-00
2000-01
2001-02
2002-03
2003-04
2004-05
2005-06
2006-07
2007-08
2008-09
2009-10
2010-11
2011-12
2012-13
2013-14
2014-15
2015-16
2016-17
2017-18
2018-19
2019-20
Percentage of total CIHR
1.1%
1.0%
1.7%
2.0%
3.2%
4.0%
3.9%
4.7%
5.0%
5.5%
8.3%
7.6%
9.3%
10.4%
12.6%
13.0%
13.0%
13.9%
13.6%
13.2%
13.6%
Percentage of total # of CIHR grants
0.7%
0.6%
0.6%
1.2%
2.1%
3.0%
3.5%
4.2%
4.4%
5.4%
6.1%
6.6%
8.0%
8.6%
10.6%
11.1%
11.2%
12.0%
11.5%
11.5%
12.4%
Figure 6: Countries with an International Linkage to a CIHR grants since 1999-00
Due to changes in methodology, figures may not reconcile with other published information
Figure 6 long description
Countries
Afghanistan
Argentina
Australia
Austria
Bangladesh
Barbados
Belgium
Benin
Brazil
Burkina Faso
Cambodia
Cameroon
Chile
China
Colombia
Costa Rica
Croatia
Cuba
Cyprus
Czech Republic
Democratic Republic of the Congo
Denmark
Ecuador
Egypt
England
Ethiopia
Finland
France
Gabon
Germany
Ghana
Greece
Guatemala
Guinea
Haiti
Hong Kong
Hungary
Iceland
India
Indonesia
Iran
Ireland
Israel
Italy
Jamaica
Japan
Kenya
Kuwait
Lao People's Democratic Republic
Latvia
Lebanon
Lithuania
Luxembourg
Malaysia
Mali
Mauritius
Mexico
Mongolia
Netherlands
New Zealand
Niger
Nigeria
Norway
Pakistan
Peru
Philippines
Poland
Portugal
Puerto Rico
Romania
Russia
Rwanda
Saudi Arabia
Scotland
Senegal
Singapore
Slovakia
South Africa
South Korea
Spain
Sri Lanka
Sudan
Sweden
Switzerland
Taiwan
Tanzania
Thailand
Turkey
Uganda
Ukraine
United Kingdom
United States
Uruguay
Vietnam
Yugoslavia
Zambia
Zimbabwe
Figure 7: Leveraged Partner Funding by Sector (in millions of dollars) – Cumulative totals from 1999-00 to 2019-20
Due to rounding, figures may not reconcile with other published information
Includes partner contributions administered by CIHR, in kind and direct contributions from partner directly to the researcher
Includes both competition and applicant partner contributions where there may or may not be a formal agreement with CIHR
Figure 7 long description
Sector
Total
Percentage
Academia
$146
5%
Federal partners
$1,190
43%
International
$297
11%
Municipal/Provincial funder
$216
8%
Not-for-profit
$424
15%
Profit
$228
8%
Unspecified
$287
10%
Total
$2,788
100%
Figure 8: Leveraged Partner Funding by Sector (in millions of dollars) – 2019-20
Due to rounding, figures may not reconcile with other published information
Includes partner contributions administered by CIHR, in kind and direct contributions from partner directly to the researcher
Includes both competition and applicant partner contributions where there may or may not be a formal agreement with CIHR
Figure 8 long description
Sector
Total
Percentage
Academia
$3
1%
Federal partner
$156
63%
International
$37
15%
Municipal/Provincial funder
$13
3%
Not-for-profit
$36
15%
Profit
$2
1%
Unspecified
$2
1%
Total
$249
100%
2018-2019
Figure 1: CIHR Fiscal Year Investments by Primary Theme since 1999-00 (in millions of dollars)
Due to rounding, figures may not reconcile with other published information
Excludes operating expenditures and partner contributions
Primary theme designation is determined by the grantee at the time of application
Figure 1 long description
Primary theme
1999-00
2000-01
2001-02
2002-03
2003-04
2004-05
2005-06
2006-07
2007-08
2008-09
2009-10
2010-11
2011-12
2012-13
2013-14
2014-15
2015-16
2016-17
2017-18
2018-19
Biomedical
$88
$160
$250
$312
$354
$381
$419
$439
$444
$474
$463
$475
$458
$455
$454
$471
$459
$478
$472
$500
Clinical
$13
$27
$47
$64
$69
$77
$82
$85
$101
$110
$126
$129
$130
$129
$130
$134
$132
$133
$140
$153
Health systems/services
$0.7
$5
$16
$25
$32
$36
$36
$34
$42
$48
$55
$58
$57
$64
$61
$66
$73
$82
$80
$86
Social/Cultural/Environmental/Population Health
$3
$9
$25
$38
$47
$56
$60
$69
$84
$85
$90
$91
$91
$92
$90
$90
$82
$83
$91
$92
Not applicable/Specified
$152
$168
$157
$148
$144
$155
$161
$172
$255
$199
$195
$213
$215
$201
$210
$197
$227
$248
$252
$258
Total
$257
$370
$494
$587
$647
$705
$758
$800
$927
$917
$929
$967
$951
$941
$944
$960
$973
$1,024
$1,035
$1,088
Figure 2: CIHR Investments by Primary Theme 2018-19 (in millions of dollars)
Due to rounding, figures may not reconcile with other published information
Excludes operating expenditures and partner contributions
Primary theme designation is determined by the grantee at the time of the application
Figure 2 long description
Primary Theme
2018-19
Percentage Breakdown
Biomedical
$500
46%
Clinical
$153
14%
Health systems/services
$86
8%
Social/Cultural/Environmental/Population Health
$92
8%
Not applicable/Specified
$258
24%
Total
$1,088
100%
Figure 3: CIHR Fiscal Year Investments by Funding Type since 1999-00 (in millions of dollars)
Due to rounding, figures may not reconcile with other published information
Excludes operating expenditures and partner contributions
Figure 3 long description
Funding type
1999-00
2000-01
2001-02
2002-03
2003-04
2004-05
2005-06
2006-07
2007-08
2008-09
2009-10
2010-11
2011-12
2012-13
2013-14
2014-15
2015-16
2016-17
2017-18
2018-19
Investigator Initiated
$176
$256
$334
$384
$410
$447
$481
$506
$545
$531
$525
$551
$556
$565
$570
$619
$632
$662
$682
$737
Research in Priority Areas
$41
$59
$97
$138
$174
$194
$215
$232
$321
$326
$331
$316
$311
$301
$302
$269
$276
$300
$294
$294
Training and Career Support
$39
$55
$64
$65
$63
$63
$63
$61
$60
$60
$73
$99
$83
$75
$72
$72
$64
$62
$59
$57
Total
$257
$370
$494
$587
$647
$705
$758
$800
$927
$917
$929
$967
$951
$941
$944
$960
$973
$1,024
$1,035
$1,088
Figure 4: CIHR Investments by Region in 2018-19 (in millions of dollars)
Due to rounding, figures may not reconcile with other published information
Excludes operating expenditures, partner contributions and direct payments
Figure 4 long description
Region
CIHR Expenditures 2018-19
Number of new and ongoing funded applications 2018-19
Alberta
$94
746
British Columbia
$144
1,062
Manitoba
$21
180
New Brunswick
$1.4
18
Newfoundland & Labrador
$5.2
40
North West Territories
$1.8
4
Nova Scotia
$21
174
Nunavut
$0
0
Ontario
$475
3,171
Prince Edward Island
$0.8
4
Quebec
$292
1,954
Saskatchewan
$21
101
Yukon
$0.2
2
Figure 5a: Number of New and Ongoing Projects
Due to rounding as well as changes in methodology, figures may not reconcile with other published information
Excludes operating expenditures and partner contributions
Figure 5a long description
Continent
1999-00
2000-01
2001-02
2002-03
2003-04
2004-05
2005-06
2006-07
2007-08
2008-09
2009-10
2010-11
2011-12
2012-13
2013-14
2014-15
2015-16
2016-17
2017-18
2018-19
Africa
0
0
0
3
9
5
6
9
8
8
11
30
38
37
41
37
34
30
27
29
Europe
5
8
11
19
27
48
66
68
63
94
108
117
157
158
202
210
204
231
229
253
North America
9
14
17
33
64
100
124
144
138
177
169
188
213
229
267
292
285
297
265
266
Oceania
1
2
4
7
14
15
19
22
22
27
40
27
49
52
56
64
62
64
70
81
Asia
0
0
0
5
9
9
2
23
47
74
106
112
115
116
105
92
71
53
43
41
South America
0
0
0
1
7
3
5
6
6
10
6
11
14
15
17
21
18
15
10
8
Figure 5b: Proportion of CIHR Grants with International linkages since 1999-00
Due to rounding as well as changes in methodology, figures may not reconcile with other published information
Excludes operating expenditures and partner contributions
Figure 5b long description
Proportion
1999-00
2000-01
2001-02
2002-03
2003-04
2004-05
2005-06
2006-07
2007-08
2008-09
2009-10
2010-11
2011-12
2012-13
2013-14
2014-15
2015-16
2016-17
2017-18
2018-19
Percentage of total CIHR
1.1%
1.0%
1.7%
2.0%
3.2%
4.0%
3.9%
4.7%
5.0%
5.5%
8.3%
7.6%
9.3%
10.4%
12.6%
13.0%
13.0%
13.9%
13.6%
13.2%
Percentage of total # of CIHR grants
0.7%
0.6%
0.6%
1.2%
2.1%
3.0%
3.5%
4.2%
4.4%
5.4%
6.1%
6.6%
8.0%
8.6%
10.6%
11.1%
11.2%
12.0%
11.5%
11.5%
Figure 6: Countries with an International Linkage to a CIHR grants since 1999-00
Due to changes in methodology, figures may not reconcile with other published information
Figure 6 long description
Countries
Afghanistan
Argentina
Australia
Austria
Bangladesh
Barbados
Belgium
Benin
Brazil
Burkina Faso
Cambodia
Cameroon
Chile
China
Colombia
Costa Rica
Croatia
Cuba
Cyprus
Czech Republic
Democratic Republic of the Congo
Denmark
Ecuador
Egypt
England
Ethiopia
Finland
France
Gabon
Germany
Ghana
Greece
Guatemala
Guinea
Haiti
Hong Kong
Hungary
Iceland
India
Indonesia
Iran
Ireland
Israel
Italy
Jamaica
Japan
Kenya
Kuwait
Lao People's Democratic Republic
Latvia
Lebanon
Lithuania
Luxembourg
Malaysia
Mali
Mauritius
Mexico
Mongolia
Netherlands
New Zealand
Niger
Nigeria
Norway
Pakistan
Peru
Philippines
Poland
Portugal
Puerto Rico
Romania
Russia
Rwanda
Saudi Arabia
Scotland
Senegal
Singapore
Slovakia
South Africa
South Korea
Spain
Sri Lanka
Sudan
Sweden
Switzerland
Taiwan
Tanzania
Thailand
Turkey
Uganda
Ukraine
United Kingdom
United States
Uruguay
Vietnam
Yugoslavia
Zambia
Zimbabwe
Figure 7: Leveraged Partner Funding by Sector (in millions of dollars) – Cumulative totals from 1999-00 to 2018-19
Due to rounding, figures may not reconcile with other published information
Includes partner contributions administered by CIHR, in kind and direct contributions from partner directly to the researcher
Includes both competition and applicant partner contributions where there may or may not be a formal agreement with CIHR
Figure 7 long description
Sector
Total
Percentage
Academia
$143
6%
Federal partners
$1,035
41%
International
$260
10%
Municipal/Provincial funder
$203
8%
Not-for-profit
$387
15%
Profit
$227
9%
Unspecified
$285
11%
Total
$2,539
100%
Figure 8: Leveraged Partner Funding by Sector (in millions of dollars) – 2018-19
Due to rounding, figures may not reconcile with other published information
Includes partner contributions administered by CIHR, in kind and direct contributions from partner directly to the researcher
Includes both competition and applicant partner contributions where there may or may not be a formal agreement with CIHR
Figure 8 long description
Sector
Total
Percentage
Academia
$5
2%
Federal partner
$147
59%
International
$43
17%
Municipal/Provincial funder
$16
7%
Not-for-profit
$35
14%
Profit
$2
1%
Unspecified
<$1
<1%
Total
$248
100%
2017-2018
Figure 1: CIHR Fiscal Year Investments by Primary Theme since 1999-00 (in millions of dollars)
Due to rounding, figures may not reconcile with other published information
Excludes operating expenditures and partner contributions
Primary theme designation is determined by the grantee at the time of application
Figure 1 long description
Primary theme
1999-00
2000-01
2001-02
2002-03
2003-04
2004-05
2005-06
2006-07
2007-08
2008-09
2009-10
2010-11
2011-12
2012-13
2013-14
2014-15
2015-16
2016-17
2017-18
Biomedical
$88
$160
$250
$312
$354
$381
$419
$439
$444
$474
$463
$475
$458
$455
$454
$471
$459
$478
$472
Clinical
$13
$27
$47
$64
$69
$77
$82
$85
$101
$110
$126
$129
$130
$129
$130
$134
$132
$133
$140
Health systems/services
$0.7
$5
$16
$25
$32
$36
$36
$34
$42
$48
$55
$58
$57
$64
$61
$66
$73
$82
$80
Social/Cultural/Environmental/Population Health
$3
$9
$25
$38
$47
$56
$60
$69
$84
$85
$90
$91
$91
$92
$90
$90
$82
$83
$91
Not applicable/Specified
$152
$168
$157
$148
$144
$155
$161
$172
$255
$199
$195
$213
$215
$201
$210
$197
$227
$248
$252
Total
$257
$370
$494
$587
$647
$705
$758
$800
$927
$917
$929
$967
$951
$941
$944
$960
$973
$1,024
$1,035
Figure 2: CIHR Investments by Primary Theme 2017-18 (in millions of dollars)
Due to rounding, figures may not reconcile with other published information
Excludes operating expenditures and partner contributions
Primary theme designation is determined by the grantee at the time of the application
Figure 2 long description
Primary Theme
2017-18
Percentage Breakdown
Biomedical
$472
46%
Clinical
$140
13%
Health systems/services
$81
8%
Social/Cultural/Environmental/Population Health
$91
9%
Not applicable/Specified
$252
24%
Total
$1,035
100%
Figure 3: CIHR Fiscal Year Investments by Funding Type since 1999-00 (in millions of dollars)
Due to rounding, figures may not reconcile with other published information
Excludes operating expenditures and partner contributions
Figure 3 long description
Funding type
1999-00
2000-01
2001-02
2002-03
2003-04
2004-05
2005-06
2006-07
2007-08
2008-09
2009-10
2010-11
2011-12
2012-13
2013-14
2014-15
2015-16
2016-17
2017-18
Investigator Initiated
$176
$256
$334
$384
$410
$447
$481
$506
$545
$531
$525
$551
$556
$565
$570
$619
$632
$662
$682
Research in Priority Areas
$41
$59
$97
$138
$174
$194
$215
$232
$321
$326
$331
$316
$311
$301
$302
$269
$276
$300
$294
Training and Career Support
$39
$55
$64
$65
$63
$63
$63
$61
$60
$60
$73
$99
$83
$75
$72
$72
$64
$62
$59
Total
$257
$370
$494
$587
$647
$705
$758
$800
$927
$917
$929
$967
$951
$941
$944
$960
$973
$1,024
$1,035
Figure 4: CIHR Investments by Region in 2017-18 (in millions of dollars)
Due to rounding, figures may not reconcile with other published information
Excludes operating expenditures, partner contributions and direct payments
Figure 4 long description
Region
CIHR Expenditures 2017-18
Number of new and ongoing funded applications 2017-18
Alberta
$90
678
British Columbia
$136
1,034
Manitoba
$23
174
New Brunswick
$0.9
19
Newfoundland & Labrador
$4.9
46
North West Territories
$1.6
1
Nova Scotia
$18
153
Nunavut
$0
0
Ontario
$446
3,021
Prince Edward Island
$0.3
3
Quebec
$286
1,935
Saskatchewan
$18
90
Yukon
$0
0
Figure 5a: Number of New and Ongoing Projects
Due to rounding as well as changes in methodology, figures may not reconcile with other published information
Excludes operating expenditures and partner contributions
Figure 5a long description
Continent
1999-00
2000-01
2001-02
2002-03
2003-04
2004-05
2005-06
2006-07
2007-08
2008-09
2009-10
2010-11
2011-12
2012-13
2013-14
2014-15
2015-16
2016-17
2017-18
Africa
0
0
0
3
9
5
6
9
8
8
11
30
38
37
41
37
34
30
27
Europe
5
8
11
19
27
48
66
68
63
94
108
117
157
158
202
210
204
231
229
North America
9
14
17
33
64
100
124
144
138
177
169
188
213
229
267
292
285
297
265
Oceania
1
2
4
7
14
15
19
22
22
27
40
27
49
52
56
64
62
64
70
Asia
0
0
0
5
9
9
2
23
47
74
106
112
115
116
105
92
71
53
43
South America
0
0
0
1
7
3
5
6
6
10
6
11
14
15
17
21
18
15
10
Figure 5b: Proportion of CIHR Grants with International linkages since 1999-00
Due to rounding as well as changes in methodology, figures may not reconcile with other published information
Excludes operating expenditures and partner contributions
Figure 5b long description
Proportion
1999-00
2000-01
2001-02
2002-03
2003-04
2004-05
2005-06
2006-07
2007-08
2008-09
2009-10
2010-11
2011-12
2012-13
2013-14
2014-15
2015-16
2016-17
2017-18
Percentage of total CIHR
1.1%
1.0%
1.7%
2.0%
3.2%
4.0%
3.9%
4.7%
5.0%
5.5%
8.3%
7.6%
9.3%
10.4%
12.6%
13.0%
13.0%
13.9%
13.6%
Percentage of total # of CIHR grants
0.7%
0.6%
0.6%
1.2%
2.1%
3.0%
3.5%
4.2%
4.4%
5.4%
6.1%
6.6%
8.0%
8.6%
10.6%
11.1%
11.2%
12.0%
11.5%
Figure 6: Countries with an International Linkage to a CIHR grants since 1999-00
Due to changes in methodology, figures may not reconcile with other published information
Figure 6 long description
Countries
Afghanistan
Argentina
Australia
Austria
Bangladesh
Barbados
Belgium
Benin
Brazil
Burkina Faso
Cambodia
Cameroon
Chile
China
Colombia
Costa Rica
Croatia
Cuba
Cyprus
Czech Republic
Democratic Republic of the Congo
Denmark
Ecuador
Egypt
England
Ethiopia
Finland
France
Gabon
Germany
Ghana
Greece
Guatemala
Guinea
Haiti
Hong Kong
Hungary
Iceland
India
Indonesia
Iran
Ireland
Israel
Italy
Jamaica
Japan
Kenya
Kuwait
Lao People's Democratic Republic
Latvia
Lebanon
Lithuania
Luxembourg
Malaysia
Mali
Mauritius
Mexico
Mongolia
Netherlands
New Zealand
Niger
Nigeria
Norway
Pakistan
Peru
Philippines
Poland
Portugal
Puerto Rico
Romania
Russia
Rwanda
Saudi Arabia
Scotland
Senegal
Singapore
Slovakia
South Africa
South Korea
Spain
Sri Lanka
Sudan
Sweden
Switzerland
Taiwan
Tanzania
Thailand
Turkey
Uganda
Ukraine
United Kingdom
United States
Uruguay
Vietnam
Yugoslavia
Zambia
Zimbabwe
Figure 7: Leveraged Partner Funding by Sector (in millions of dollars) – Cumulative totals from 1999-00 to 2017-18
Due to rounding, figures may not reconcile with other published information
Includes partner contributions administered by CIHR, in kind and direct contributions from partner directly to the researcher
Includes both competition and applicant partner contributions where there may or may not be a formal agreement with CIHR
Figure 7 long description
Sector
Total
Percentage
Academia
$138
6%
Federal partners
$888
39%
International
$217
9%
Municipal/Provincial funder
$186
8%
Not-for-profit
$353
15%
Profit
$224
10%
Unspecified
$285
12%
Total
$2,291
100%
Figure 8: Leveraged Partner Funding by Sector (in millions of dollars) – 2017-18
Due to rounding, figures may not reconcile with other published information
Includes partner contributions administered by CIHR, in kind and direct contributions from partner directly to the researcher
Includes both competition and applicant partner contributions where there may or may not be a formal agreement with CIHR
Figure 8 long description
Sector
Total
Percentage
Academia
$5
2%
Federal partner
$135
57%
International
$37
16%
Municipal/Provincial funder
$23
10%
Not-for-profit
$33
14%
Profit
$4
2%
Unspecified
<$1
<1%
Total
$235
100%
2016-2017
Figure 1: CIHR Fiscal Year Investments by Primary Theme since 1999-00 (in millions of dollars)
Due to rounding, figures may not reconcile with other published information
Excludes operating expenditures and partner contributions
Primary theme designation is determined by the grantee at the time of application
Figure 1 long description
Primary theme
1999-00
2000-01
2001-02
2002-03
2003-04
2004-05
2005-06
2006-07
2007-08
2008-09
2009-10
2010-11
2011-12
2012-13
2013-14
2014-15
2015-16
2016-17
Biomedical
$88
$160
$250
$312
$354
$381
$419
$439
$444
$474
$463
$475
$458
$455
$454
$471
$459
$478
Clinical
$13
$27
$47
$64
$69
$77
$82
$85
$101
$110
$126
$129
$130
$129
$130
$134
$132
$133
Health systems/services
$0.7
$5
$16
$25
$32
$36
$36
$34
$42
$48
$55
$58
$57
$64
$61
$66
$73
$82
Social/Cultural/Environmental/Population Health
$3
$9
$25
$38
$47
$56
$60
$69
$84
$85
$90
$91
$91
$92
$90
$90
$82
$83
Not applicable/Specified
$152
$168
$157
$148
$144
$155
$161
$172
$255
$199
$195
$213
$215
$201
$210
$197
$227
$248
Total
$257
$370
$494
$587
$647
$705
$758
$800
$927
$917
$929
$967
$951
$941
$944
$960
$973
$1,024
Figure 2: CIHR Investments by Primary Theme 2016-17 (in millions of dollars)
Due to rounding, figures may not reconcile with other published information
Excludes operating expenditures and partner contributions
Primary theme designation is determined by the grantee at the time of the application
Figure 2 long description
Primary Theme
2016-17
Percentage Breakdown
Biomedical
$478
47%
Clinical
$134
13%
Health systems/services
$82
8%
Social/Cultural/Environmental/Population Health
$83
8%
Not applicable/Specified
$248
24%
Total
$1,024
100%
Figure 3: CIHR Fiscal Year Investments by Funding Type since 1999-00 (in millions of dollars)
Due to rounding, figures may not reconcile with other published information
Excludes operating expenditures and partner contributions
Figure 3 long description
Funding type
1999-00
2000-01
2001-02
2002-03
2003-04
2004-05
2005-06
2006-07
2007-08
2008-09
2009-10
2010-11
2011-12
2012-13
2013-14
2014-15
2015-16
2016-17
Investigator Initiated
$176
$256
$334
$384
$410
$447
$481
$506
$545
$531
$525
$551
$556
$565
$570
$619
$632
$662
Research in Priority Areas
$41
$59
$97
$138
$174
$194
$215
$232
$321
$326
$331
$316
$311
$301
$302
$269
$276
$300
Training and Career Support
$39
$55
$64
$65
$63
$63
$63
$61
$60
$60
$73
$99
$83
$75
$72
$72
$64
$62
Total
$257
$370
$494
$587
$647
$705
$758
$800
$927
$917
$929
$967
$951
$941
$944
$960
$973
$1,024
Figure 4: CIHR Investments by Region in 2016-17 (in millions of dollars)
Due to rounding, figures may not reconcile with other published information
Excludes operating expenditures, partner contributions and direct payments
Figure 4 long description
Region
CIHR Expenditures 2016-17
Number of new and ongoing funded applications 2016-17
Alberta
$90
709
British Columbia
$136
1,040
Manitoba
$24
202
New Brunswick
$1.1
19
Newfoundland & Labrador
$4.5
33
North West Territories
$1.5
1
Nova Scotia
$19
171
Nunavut
$0.01
1
Ontario
$437
3,090
Prince Edward Island
$2.5
4
Quebec
$281
2,013
Saskatchewan
$17
105
Yukon
$0
0
Figure 5a: Number of New and Ongoing Projects
Due to rounding as well as changes in methodology, figures may not reconcile with other published information
Excludes operating expenditures and partner contributions
Figure 5a long description
Continent
1999-00
2000-01
2001-02
2002-03
2003-04
2004-05
2005-06
2006-07
2007-08
2008-09
2009-10
2010-11
2011-12
2012-13
2013-14
2014-15
2015-16
2016-17
Africa
0
0
0
3
9
5
6
9
8
8
11
30
38
37
41
37
34
30
Europe
5
8
11
19
27
48
66
68
63
94
108
117
157
158
202
210
204
231
North America
9
14
17
33
64
100
124
144
138
177
169
188
213
229
267
292
285
297
Oceania
1
2
4
7
14
15
19
22
22
27
40
27
49
52
56
64
62
64
Asia
0
0
0
5
9
9
2
23
47
74
106
112
115
116
105
92
71
53
South America
0
0
0
1
7
3
5
6
6
10
6
11
14
15
17
21
18
15
Figure 5b: Proportion of CIHR Grants with International linkages since 1999-00
Due to rounding as well as changes in methodology, figures may not reconcile with other published information
Excludes operating expenditures and partner contributions
Figure 5b long description
Proportion
1999-00
2000-01
2001-02
2002-03
2003-04
2004-05
2005-06
2006-07
2007-08
2008-09
2009-10
2010-11
2011-12
2012-13
2013-14
2014-15
2015-16
2016-17
Percentage of total CIHR
1.1%
1.0%
1.7%
2.0%
3.2%
4.0%
3.9%
4.7%
5.0%
5.5%
8.3%
7.6%
9.3%
10.4%
12.6%
13.0%
13.0%
13.9%
Percentage of total # of CIHR grants
0.7%
0.6%
0.6%
1.2%
2.1%
3.0%
3.5%
4.2%
4.4%
5.4%
6.1%
6.6%
8.0%
8.6%
10.6%
11.1%
11.2%
12.0%
Figure 6: Countries with an International Linkage to a CIHR grants since 1999-00
Due to changes in methodology, figures may not reconcile with other published information
Figure 6 long description
Countries
Afghanistan
Argentina
Australia
Austria
Bangladesh
Barbados
Belgium
Benin
Brazil
Burkina Faso
Cambodia
Cameroon
Chile
China
Colombia
Costa Rica
Croatia
Cuba
Cyprus
Czech Republic
Democratic Republic of the Congo
Denmark
Ecuador
Egypt
England
Ethiopia
Finland
France
Gabon
Germany
Ghana
Greece
Guatemala
Guinea
Haiti
Hong Kong
Hungary
Iceland
India
Indonesia
Iran
Ireland
Israel
Italy
Jamaica
Japan
Kenya
Kuwait
Lao People's Democratic Republic
Latvia
Lebanon
Lithuania
Luxembourg
Malaysia
Mali
Mauritius
Mexico
Mongolia
Netherlands
New Zealand
Niger
Nigeria
Norway
Pakistan
Peru
Philippines
Poland
Portugal
Puerto Rico
Romania
Russia
Rwanda
Saudi Arabia
Scotland
Senegal
Singapore
Slovakia
South Africa
South Korea
Spain
Sri Lanka
Sudan
Sweden
Switzerland
Taiwan
Tanzania
Thailand
Turkey
Uganda
Ukraine
United Kingdom
United States
Uruguay
Vietnam
Yugoslavia
Zambia
Zimbabwe
Figure 7: Leveraged Partner Funding by Sector (in millions of dollars) – Cumulative totals from 1999-00 to 2016-17
Due to rounding, figures may not reconcile with other published information
Includes partner contributions administered by CIHR, in kind and direct contributions from partner directly to the researcher
Includes both competition and applicant partner contributions where there may or may not be a formal agreement with CIHR
Figure 7 long description
Sector
Total
Percentage
Academia
$133
6%
Federal partners
$753
37%
International
$181
9%
Municipal/Provincial funder
$164
8%
Not-for-profit
$320
16%
Profit
$221
11%
Unspecified
$285
14%
Total
$2,056
100%
Figure 8: Leveraged Partner Funding by Sector (in millions of dollars) – 2016-17
Due to rounding, figures may not reconcile with other published information
Includes partner contributions administered by CIHR, in kind and direct contributions from partner directly to the researcher
Includes both competition and applicant partner contributions where there may or may not be a formal agreement with CIHR